Increasing and Decreasing Functions
TLDRThe video script is an educational lesson on the concepts of increasing and decreasing functions in calculus. It begins with an informal explanation of these terms using the visual representation of a graph's slope. The instructor then formalizes the concepts by relating them to the behavior of the function's derivative. A function is increasing if its derivative is positive, meaning the graph rises from left to right, and decreasing if its derivative is negative. The lesson explores how to identify critical points where the function's behavior changes, such as at turning points or discontinuities like asymptotes. The instructor demonstrates how to find these critical numbers by setting the derivative to zero or undefined and then testing intervals to determine if the function is increasing or decreasing in those regions. The script includes several examples with different types of functions, such as rational, polynomial, and radical functions, and concludes with a practical application involving cost, revenue, and profit analysis for a toy distributor. The lesson emphasizes the importance of understanding these concepts without relying solely on graphing tools, preparing students for more advanced mathematical work and exams where calculators may not be allowed.
Takeaways
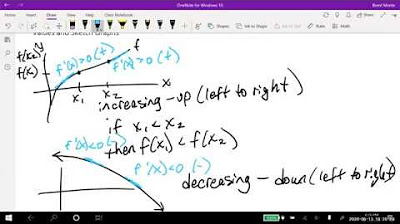
- 📈 A function is considered increasing if its graph rises as we move from left to right, meaning as the x-values increase, so do the y-values.
- 📉 Conversely, a function is decreasing if its graph falls from left to right, indicating that y-values decrease as x-values increase.
- 🔄 Positive slope in a function indicates an increasing function, while a negative slope corresponds to a decreasing function.
- 🧮 The derivative of a function at any point can be used to find the slope of the function at that point; a positive derivative indicates an increasing function, and a negative one indicates a decreasing function.
- 🚫 If a function is neither increasing nor decreasing, it could be constant (slope of zero) or undefined (due to a discontinuity like an asymptote or turning point).
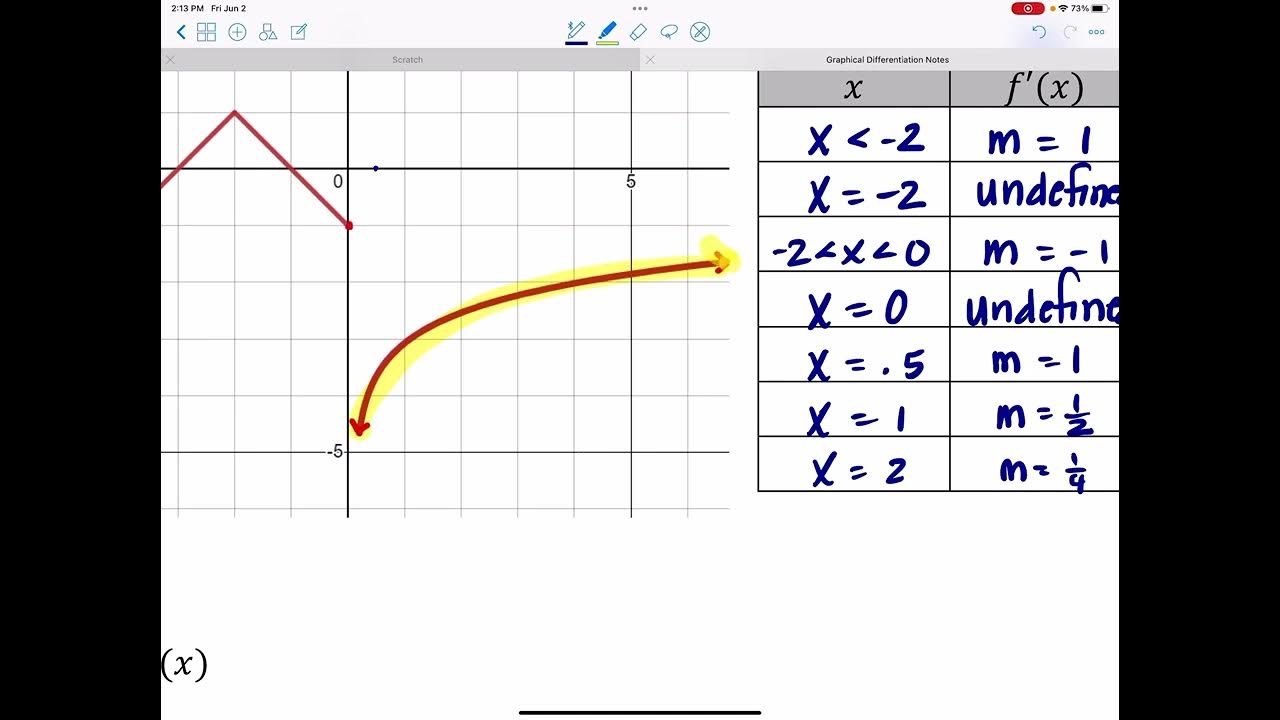
- ✅ To determine where a function is increasing or decreasing without a graph, find the derivative (f'(x)) and solve for critical numbers where the derivative is zero or undefined.
- 📊 After finding critical numbers, test intervals before, between, and after these numbers by plugging in x-values into the derivative to see if it's positive (increasing) or negative (decreasing).
- 🤔 The behavior of a function can change at critical points, such as turning points or discontinuities, which are where the function transitions from increasing to decreasing or vice versa.
- 📌 Critical numbers are the x-values where the slope of the function is zero or undefined, and they separate the intervals of increasing and decreasing behavior.
- 📚 In the context of business, understanding the intervals of increasing profit can be crucial for decision-making, such as determining the optimal number of units to produce for maximum profit.
- 🔢 For polynomial functions, the domain is all real numbers, and the critical numbers are found by setting the derivative equal to zero, as the derivative cannot be undefined.
Q & A
What does it mean for a function to be increasing?
-A function is considered increasing if, when read from left to right, the graph of the function moves upwards. This means that as the x-values increase, the y-values also increase, resulting in a positive slope.
What is the formal definition of a decreasing function?
-A function is decreasing if, for every x in its domain, the function values are lower when x is larger. In other words, as x increases, y decreases, which corresponds to a negative slope.
How is the slope of a function related to its derivative?
-The slope of a function at any given point is directly related to the derivative of the function at that point. A positive slope indicates an increasing function with a positive derivative, while a negative slope indicates a decreasing function with a negative derivative.
What does it imply if a function's graph is neither increasing nor decreasing?
-If a function's graph is neither increasing nor decreasing, it could be constant (with a slope of zero) or undefined (due to a discontinuity like a vertical asymptote or a turning point). At a turning point, the slope is zero, and at a discontinuity like an asymptote, the slope is undefined.
How can you determine the intervals where a function is increasing or decreasing without a graph?
-To determine the intervals where a function is increasing or decreasing without a graph, you first find the derivative of the function. Then, you find the critical numbers where the derivative is zero or undefined. These critical numbers serve as separators for the intervals. You then test values before, between, and after these critical numbers to determine the sign of the derivative and thus the behavior of the function.
What is a critical number in the context of analyzing a function's behavior?
-A critical number is an x-value at which the derivative of the function is either zero or undefined. These points are significant because they can indicate a change in the function's behavior, such as a turning point or a discontinuity.
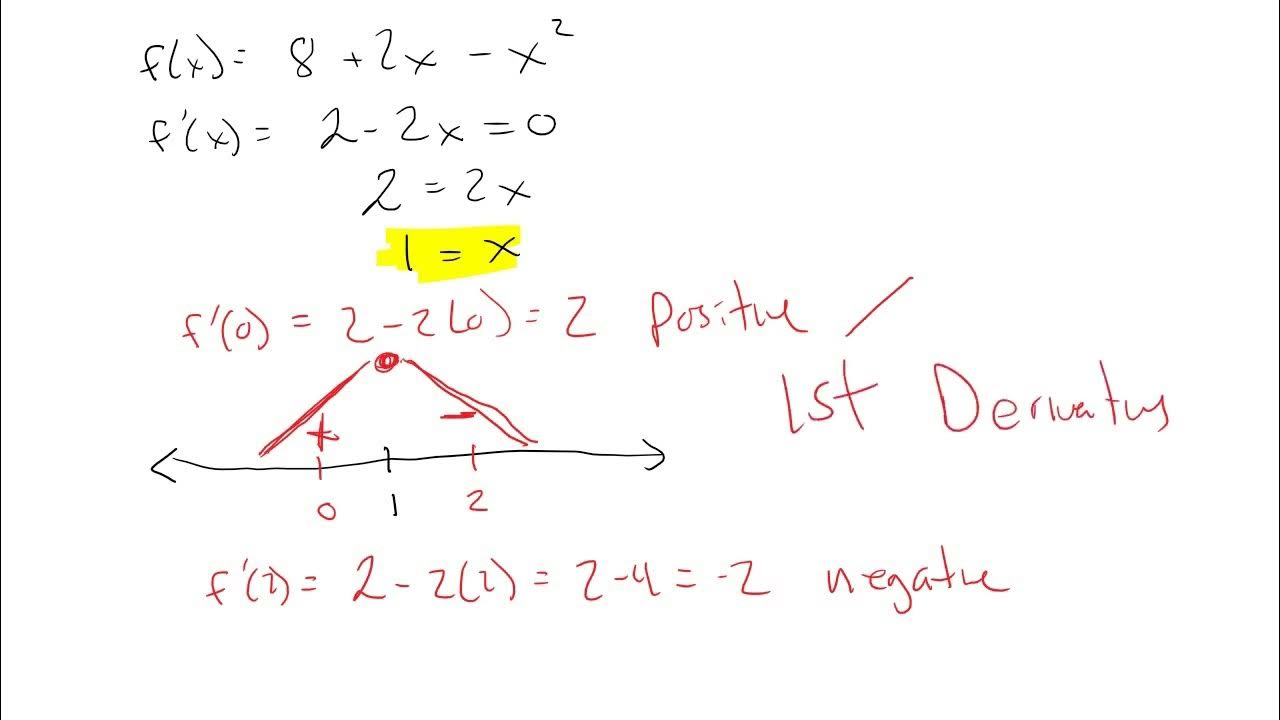
How does the behavior of a quadratic function relate to its critical points?
-For a quadratic function, which is a parabola, the critical point is the vertex of the parabola. If the parabola opens upwards (positive leading coefficient), the function is decreasing before the vertex and increasing after it. Conversely, if the parabola opens downwards, the function is increasing before the vertex and decreasing after it.
What is the significance of finding the profit function's critical number in a business context?
-In a business context, the critical number of the profit function indicates the production level at which the profit starts to decrease. This is crucial for decision-making, as a company would want to maximize profit by producing up to but not beyond this critical number of units.
How can you use the derivative of a profit function to determine the intervals of increasing profit?
-By finding the derivative of the profit function, you can determine the critical number(s) where the derivative is zero or undefined. You then test values before and after these critical numbers by plugging them into the derivative. If the derivative is positive, the profit is increasing; if negative, the profit is decreasing. This allows you to identify the intervals of production levels where profit is increasing.
What is the role of the quotient rule in differentiating rational functions?
-The quotient rule is used to differentiate rational functions, which are functions expressed as the quotient of two polynomial functions. The rule states that the derivative of a quotient of two functions is the denominator times the derivative of the numerator minus the numerator times the derivative of the denominator, all divided by the square of the denominator.
Why is it important to verify the work done by hand with a graphing calculator or software like Desmos?
-Verifying the work done by hand with a graphing calculator or software like Desmos is important because it ensures the accuracy of the manual calculations and helps to visualize the function's behavior. This is particularly useful for complex functions or when preparing for exams where calculators may not be allowed.
Outlines
📈 Understanding Increasing and Decreasing Functions
The first paragraph introduces the concepts of increasing and decreasing functions. It explains that an increasing function is one where the graph rises as we move from left to right, and a decreasing function is where the graph falls in the same direction. The paragraph also touches on the formal definition involving the increase in x values leading to an increase (or decrease) in y values. It further discusses the relationship between the slope of a function and its derivative, stating that a positive slope corresponds to a positive derivative, and vice versa for a negative slope.
🔍 Identifying Critical Points and Discontinuities
The second paragraph delves into the formal identification of when a function is constant or undefined, which can occur at turning points or discontinuities like asymptotes. It emphasizes the importance of recognizing these points as they signify changes from increasing to decreasing (or vice versa) or intervals that need to be separated in the graph. The concept of critical numbers is introduced as x-values where the slope is zero or undefined, which are essential for determining the intervals of increase or decrease.
🧮 Calculating Derivatives to Find Increasing/Decreasing Intervals
The third paragraph outlines the process of finding where a graph is increasing or decreasing without a graphing tool. It details the steps of finding the derivative of a function, identifying critical numbers where the derivative is zero or undefined, and using these to divide the number line into intervals. The behavior of the function in these intervals is then determined by testing values before, between, and after the critical numbers. If the derivative is positive, the function is increasing; if negative, it is decreasing.
📚 Analyzing the Behavior of Rational Functions
The fourth paragraph provides an example of analyzing a rational function. It demonstrates how to find the derivative, identify critical numbers where the derivative is zero or undefined, and use these to determine the intervals of increase or decrease. The example highlights that the function is increasing almost everywhere except at the critical number, where the function is undefined due to a discontinuity.
📊 Verifying Behavior with Graphs
The fifth paragraph emphasizes the utility of graphs in verifying the analytical work done to find where a graph is increasing or decreasing. It shows how the graphical representation of a function can confirm the critical numbers and the behavior of the function in different intervals. The paragraph reassures that even though the work can be complex, it aligns with the graphical behavior of the function.
🔢 Working with Polynomial Functions
The sixth paragraph focuses on working with polynomial functions. It demonstrates finding the derivative of a polynomial and then determining the critical numbers by setting the derivative equal to zero. The paragraph explains that polynomials are defined everywhere, so the only critical numbers to consider are those where the derivative is zero, indicating a turning point in the graph.
🤝 Applying Calculus to Business: Profit Analysis
The seventh paragraph connects calculus to a business context by analyzing the cost, revenue, and profit functions for a toy distributor. It shows how to calculate the profit function and find the critical number where the derivative of the profit function is zero, indicating the point at which the rate of profit changes. The paragraph concludes that the profit increases when manufacturing between zero and three thousand toys.
🧐 Final Thoughts on Manual Calculations
The eighth paragraph wraps up the discussion by reminding students that while calculators will be available during exams, they should be prepared to do manual calculations, especially if their next instructor does not allow the use of calculators. It encourages students to reach out if they have questions and to take careful notes to avoid common mistakes.
📉 Determining Profit Maximization
The ninth paragraph concludes the lesson by focusing on the practical application of finding when profits are increasing for the toy distributor. It shows the process of finding the derivative of the profit function and identifying the critical number that separates the intervals of increasing and decreasing profits. The paragraph advises that manufacturing more than three thousand toys leads to decreasing profits, highlighting the importance of this analysis for business decisions.
🔃 Reviewing the Profit Function and Its Behavior
The tenth paragraph reviews the profit function and its behavior by double-checking the calculations and ensuring that there are no errors. It emphasizes the importance of accuracy and provides a final confirmation of the function's behavior through a graph, showing the turning point at three thousand toys where the slope of the profit function becomes zero, and the profit starts to decrease.
Mindmap
Keywords
💡Increasing Function
💡Decreasing Function
💡Slope
💡Derivative
💡Critical Numbers
💡Turning Point
💡Discontinuity
💡Rational Function
💡Polynomial Function
💡Radical Function
💡Profit Function
Highlights
The lesson introduces the concepts of increasing and decreasing functions, explaining how to determine the behavior of a function's graph as it moves from left to right.
A function is considered increasing if its graph moves upwards as we read from left to right, indicating that Y values increase as X values increase.
An increasing function has a positive slope, which is directly related to the derivative being positive.
A function is decreasing if, as X increases, Y values decrease, resulting in a graph that moves downward from left to right.
A decreasing function has a negative slope, which means its derivative is negative, placing it below the x-axis.
If a graph is neither increasing nor decreasing, it could be constant or undefined, which might occur at turning points or discontinuities like asymptotes.
Turning points and discontinuities are critical in determining where the function changes from increasing to decreasing or vice versa.
Critical numbers are the X values where the slope of the function is either zero or undefined, which are found by setting the derivative to zero or finding where it's undefined.
To find where a graph is increasing or decreasing without a graph, one must find the derivative, then the critical numbers, and test intervals before, between, and after these numbers.
The process of finding the derivative, critical numbers, and testing intervals is demonstrated through examples including rational, polynomial, and radical functions.
The derivative of a function at a given point, if greater than zero, indicates an increasing function, while less than zero indicates a decreasing function.
The lesson concludes with a practical application, using the concepts to determine the intervals over which the profit of a toy distributor increases.
The profit function is derived by subtracting the cost function from the revenue function, and its behavior is analyzed using the previously explained methods.
The importance of understanding these concepts without relying on calculators is emphasized, as it prepares students for more advanced mathematics where such tools may not be available.
The transcript provides a comprehensive guide to understanding and applying the concepts of increasing and decreasing functions in various mathematical contexts.
The process of verifying the work done by hand with graphical representation using tools like graphing calculators or Desmos is highlighted to ensure accuracy.
The lesson emphasizes the need for careful work, particularly when transitioning to more advanced classes where the ability to perform calculations by hand is crucial.
Transcripts


5.0 / 5 (0 votes)
Thanks for rating: