Calculating Residuals & Making Residual Plots on TI-84 Plus
TLDRThe video script discusses the concept of residuals in the context of linear regression analysis. It explains how residuals, the differences between observed and predicted values, can be calculated and plotted to evaluate the accuracy of a model. The script provides a step-by-step guide on using a calculator for linear regression and residual plot creation, emphasizing the importance of random scatter and small residuals as indicators of a good model fit. It also introduces the calculation of R-squared and standard deviation of residuals, highlighting their significance in measuring the model's explanatory power and prediction accuracy.
Takeaways
- 📊 A residual is the difference between the observed value and the predicted value from a model.
- 🌳 The example given discusses the yield of avocados from a 14-foot-tall tree and its residuals.
- 🔢 The predicted yield for the 14ft tree was calculated using the equation: 2.39 * 14 ft + 231.50, resulting in approximately 531.4 lb.
- 📈 The residual for the 14ft tree was found to be 442.19 lb, indicating a higher yield than expected.
- 🖱️ To create a residual plot, input tree heights and yields into the calculator and use linear regression to find the slope and intercept.
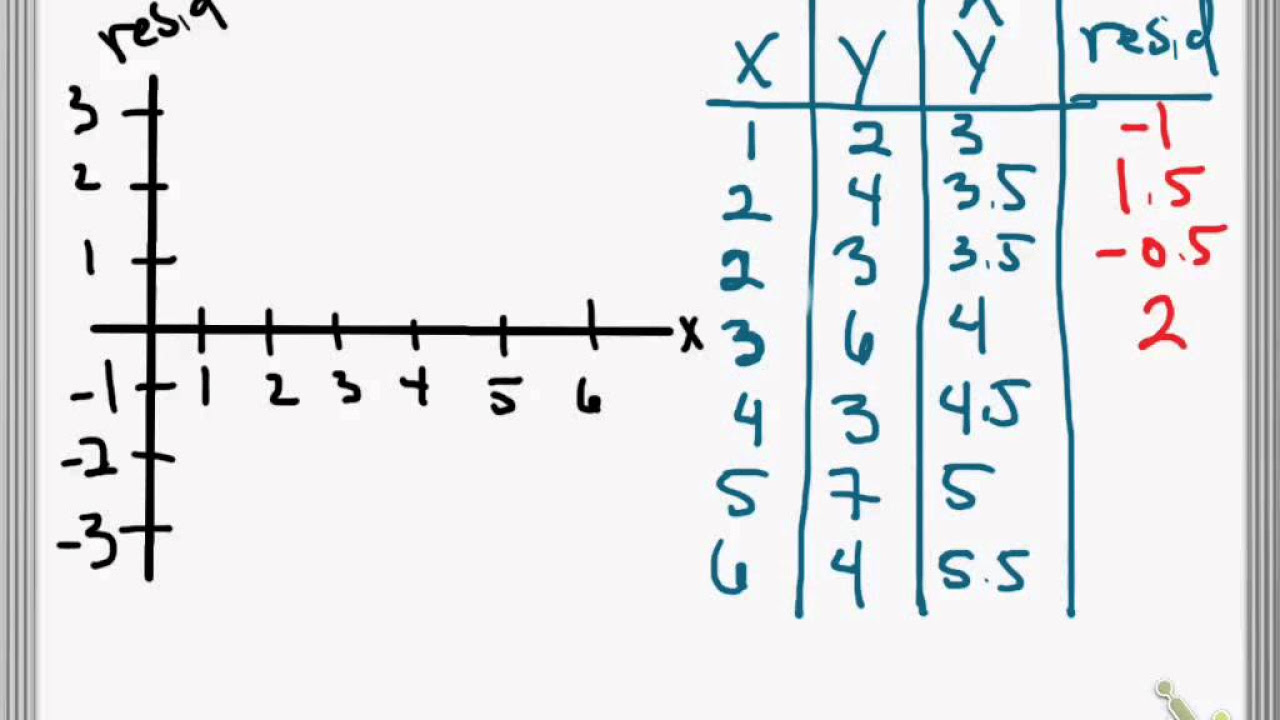
- 📝 In the residual plot, list one contains tree heights, list two contains yields, and list three contains the expected values from the regression equation.
- 📊 Residuals are calculated by subtracting the expected values (list three) from the observed values (list two).
- 📉 A negative residual indicates an observed yield lower than the model's prediction, while a positive residual indicates a higher yield.
- 📊 The residual plot should show a random scatter, which suggests that the model is a good fit for the data.
- 📐 The R-squared value (r²) represents the proportion of the variance for the dependent variable that's explained by the independent variable.
- 🔍 The standard deviation of the residuals (s) measures the average error in predicting the yield from tree height using the least squares regression equation.
Q & A
What is a residual in the context of the script?
-A residual is the difference between the observed value and the predicted value. It is calculated by subtracting the expected yield (based on the model) from the actual observed yield.
How was the predicted yield for a 14-foot tree calculated?
-The predicted yield for a 14-foot tree was calculated using the equation from the day 22 problem. The equation was 2.39 (slope) multiplied by 14 (tree height in feet) and then adding 231.50 (Y-intercept), resulting in a predicted yield of approximately 5314.
What does a positive residual indicate?
-A positive residual indicates that the actual yield was higher than what the model predicted. In the case of the 14-foot tree, it had an avocado yield of 442.19 lb over what the model would predict.
How was the residual plot created using the calculator?
-The residual plot was created by first inputting all the avocado tree heights in list one and all the yields in list two. Then, the calculator's linear regression function was used to calculate the model's slope and Y-intercept. The expected values (predicted yields) were calculated and stored in list three. Finally, the residuals were calculated by subtracting the expected values from the observed values (list two minus list three).
What does the residual plot represent?
-The residual plot represents the difference between the observed values and the expected values (predicted yields) at various tree heights. It is a graphical tool used to assess the accuracy of the regression model, where random scatter indicates a good fit.
What does the absence of a pattern in the residual plot suggest about the model?
-The absence of a pattern in the residual plot, especially with no increasing or decreasing trend in residuals as tree height varies, suggests that the model is a good fit. It indicates that the predictions are randomly distributed around the expected values, which is a sign of a well-fitted model.
How can the scale for the residual plot be determined?
-The scale for the residual plot can be determined by using the Trace button on the calculator while scrolling through the points. This will show the X and Y coordinates of the different points, providing an idea of the scale to use when copying down the plot.
What do large positive residuals mean in the context of the script?
-Large positive residuals, as seen with the trees of heights 14 and 16, indicate that the model substantially underpredicted their yield. This suggests that there might be factors other than tree height that influence yield, which are not accounted for in the model.
What is the significance of R and R-squared in the context of the script?
-R is the correlation coefficient, and R-squared is its square. R-squared measures the proportion of the variance for the dependent variable that's explained by the independent variables in the regression model. In this case, about 41.75% of the variation in yield can be explained by tree height.
How is the standard deviation of the residuals (S) interpreted?
-The standard deviation of the residuals (S) represents the average error when predicting the yield from tree height using the least squares regression equation. It measures the strength of the relationship between two variables and is expressed in the same units as the response variable.
What is the purpose of the LIN RED T Test in the calculator?
-The LIN RED T Test in the calculator is used to calculate the t-statistic for the regression analysis. This test helps to determine if there is a statistically significant relationship between the independent and dependent variables in the regression model.
What additional insights can be gained from the playlist mentioned in the script?
-The playlist mentioned in the script provides further educational content on scatter plots, least squares regression, residuals, and calculator usage. It is designed to help students deepen their understanding of these statistical concepts and improve their ability to analyze and interpret data.
Outlines
📊 Residual Analysis and Plotting
This paragraph discusses the concept of residuals in the context of observed and predicted values from a linear regression model. It uses a specific example of an avocado tree's height and yield, where the residual is calculated as the difference between the observed yield (974 lbs) and the predicted yield (calculated as 2.39 * height + 231.50). A positive residual indicates a higher yield than expected. The paragraph then explains the process of creating a residual plot using a calculator, including inputting tree heights and yields, calculating expected values, and determining residuals. The residual plot is described as showing random scatter without any clear trend, suggesting a good fit of the model. The paragraph also touches on the interpretation of residuals and their implications for model accuracy.
📈 Calculating R-Squared and Standard Deviation (S)
This paragraph delves into the calculation and interpretation of R-squared and standard deviation (S) in the context of linear regression analysis. R-squared is explained as the proportion of variation in the yield that can be explained by tree height, with the example showing that approximately 41.75% of the variation is explained. The standard deviation of the residuals (S) is introduced as a measure of the average error in predicting yield from tree height using the least squares regression equation. The paragraph emphasizes that while R-squared is unitless, S is measured in the same units as the response variable and is sensitive to changes in these units. The paragraph concludes with a mention of additional statistical concepts to be covered later and encourages further learning through a suggested playlist.
Mindmap
Keywords
💡Residual
💡Predicted Yield
💡Linear Regression
💡Slope
💡Y-Intercept
💡Residual Plot
💡Correlation (R)
💡Standard Deviation of Residuals (R.S)
💡Statistical Significance
💡Calculator Usage
💡Data Analysis
Highlights
The concept of residual is introduced as the difference between the observed value and the predicted value.
A practical example is given where a 14 ft tall tree has an observed avocado yield of 974, and the predicted yield is calculated using the equation from a previous problem.
The residual for the 14 ft tree is calculated to be 442.19 lb, indicating a higher yield than expected.
A positive residual signifies a higher yield than the model's prediction, while a negative residual indicates less.
A step-by-step guide on using a calculator to make a residual plot is provided, including inputting tree heights and yields into specific lists.
The regression equation is used to predict yields for each tree height, which are then compared to the actual observed yields to calculate residuals.
A residual plot is created to visualize the relationship between residuals and tree heights, with the x-axis representing tree heights and the y-axis representing residuals.
The residual plot is noted to be similar to the original scatter plot but rotated to have the model line horizontal.
Random scatter in the residual plot is observed, which is a good sign indicating that the model's predictions are generally accurate.
Most residuals are close to the line, suggesting that the model is effective in predicting actual yields.
Two specific cases with large positive residuals are identified, indicating that the model significantly underpredicted the yield for trees of heights 14 and 16.
The linear model is deemed appropriate overall despite the two underpredicted cases.
The process for calculating R and S, which are statistical measures of the relationship's strength and the standard deviation of the residuals, is outlined.
R-squared is explained as the percentage of variation in yield that can be explained by tree height, with the example showing 41.75% of the variation being explained.
S is described as the standard deviation of the residuals, representing the average error in predicting yield from tree height using the least squares regression equation.
The impact of changing units on the value of S is discussed, noting that it would change the value of S since it is measured in the same units as the response variable.
A brief mention of a playlist for further learning on scatter plots, least squares regression, residuals, and calculator usage is provided.
Transcripts


5.0 / 5 (0 votes)
Thanks for rating: