Residual plots | Exploring bivariate numerical data | AP Statistics | Khan Academy
TLDRThe video script discusses the concept of a residual plot in the context of regression analysis. It explains that residuals represent the difference between actual and expected values. The script illustrates how to calculate and plot residuals for a simple least squares regression, emphasizing their importance in assessing the fit of the model. A good fit is indicated by residuals that are randomly scattered, while a trend in the residuals suggests a poor fit and the potential need for a non-linear model. The script uses examples to highlight how residual plots can guide the choice of an appropriate regression model.
Takeaways
- 📈 A residual plot is used to evaluate the fit of a regression line to data points.
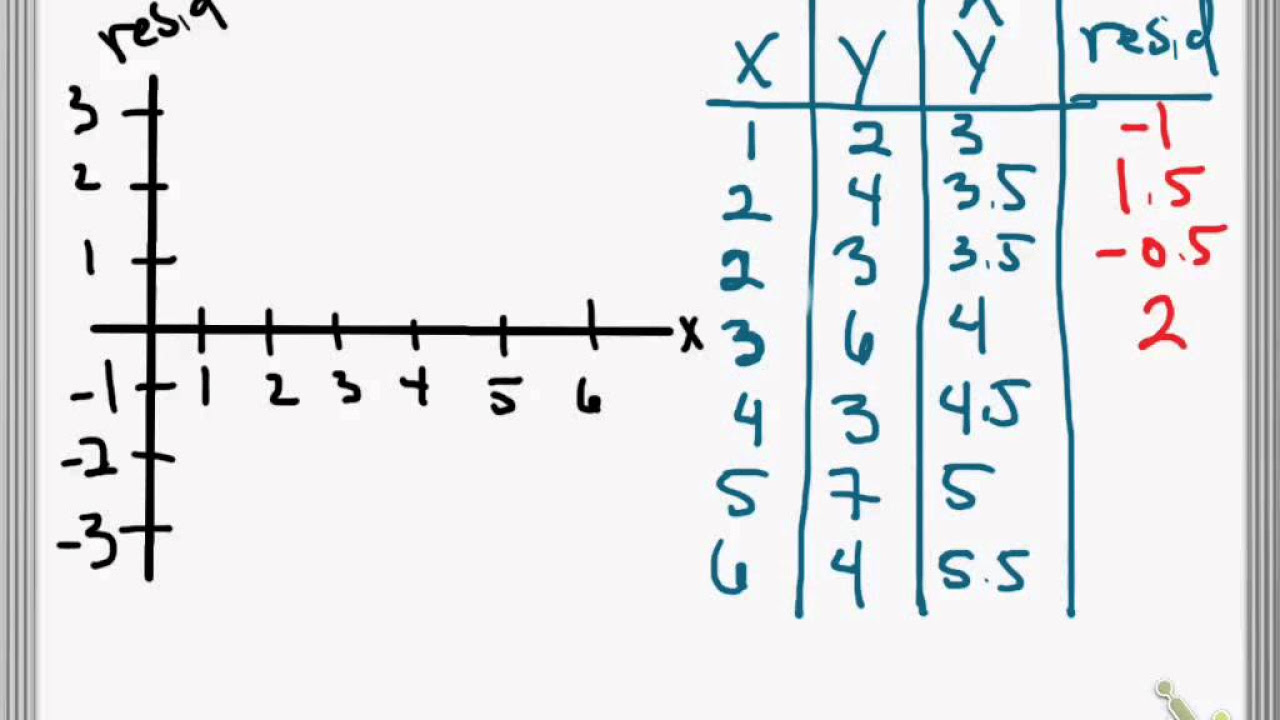
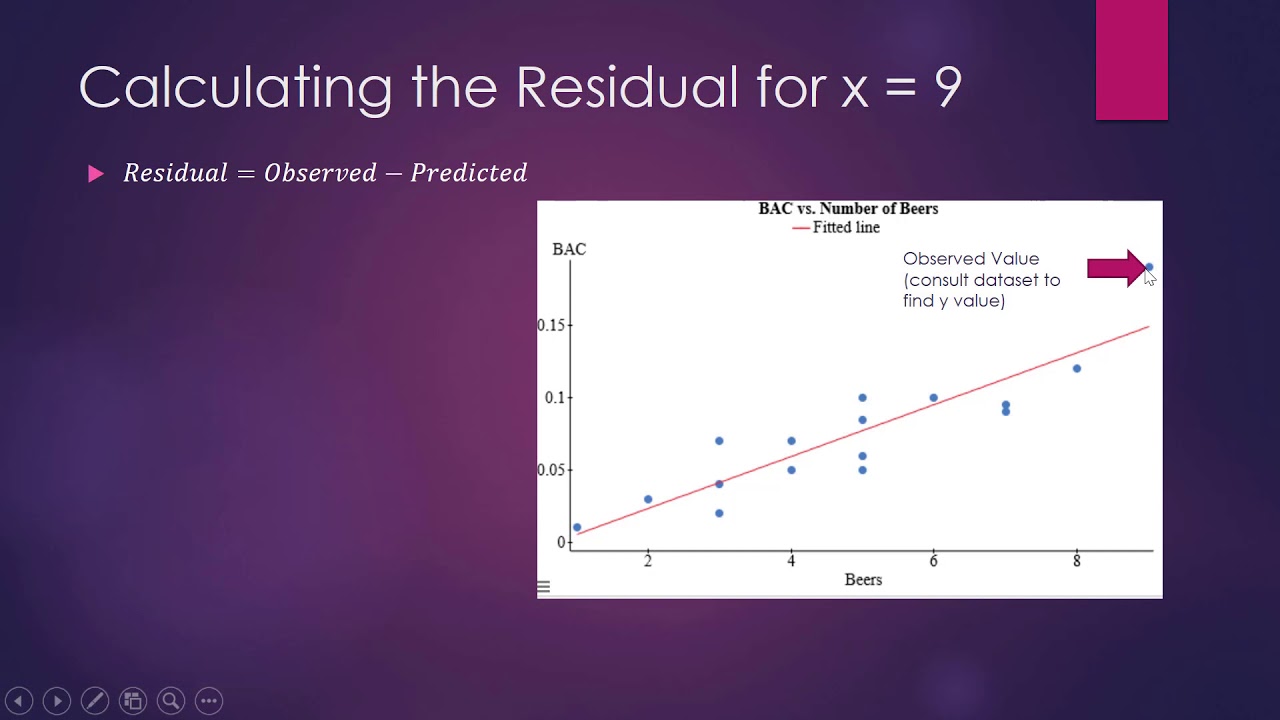
- 🔍 Residuals are calculated as the difference between the actual and expected values for a given point.
- 🤔 A positive residual indicates that the actual value is above the regression line, while a negative residual indicates it is below.
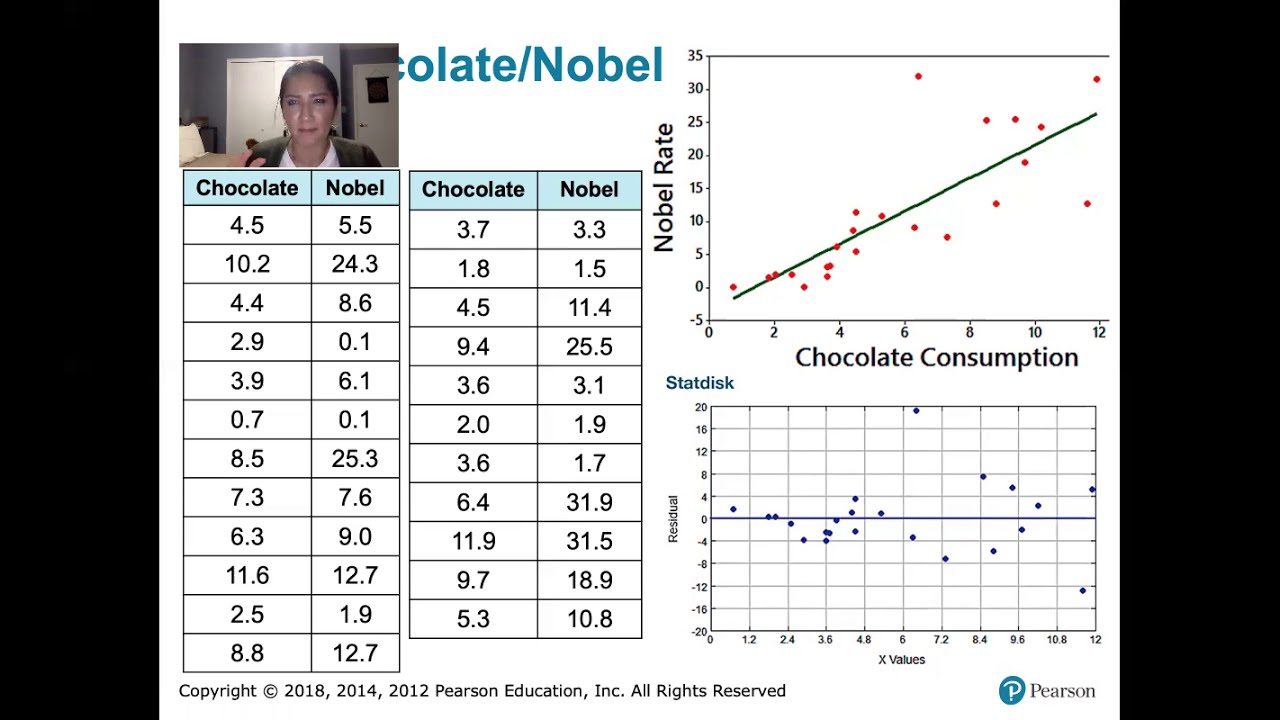
- 📊 Plotting residuals involves setting up axes based on the x-values of the data points and marking the residuals above or below a baseline.
- 🎯 The goal of a residual plot is to determine if the residuals are randomly scattered, which would suggest a good fit from the regression line.
- 📈 If a trend is observed in the residual plot, such as an upward or downward trend, it may indicate that a non-linear model is more appropriate.
- 🔢 Large residuals far from the x-axis can also indicate a poor fit of the regression line to the data.
- 📊 An example in the script shows a linear model with evenly scattered residuals, suggesting a good fit.
- 🔍 A different residual plot with a trend of going down and then up indicates a potential non-linear relationship between the variables.
- 📈 The R value, while positive, is not close to one, indicating that the model may not be the best fit for the data.
- 💡 Analyzing residual plots helps in deciding whether to stick with a linear model or to explore non-linear alternatives for better data fit.
Q & A
What is the main topic of the video?
-The main topic of the video is the concept and analysis of a residual plot in the context of regression analysis.
What is a residual in the context of regression?
-A residual is the difference between the actual observed value and the expected value predicted by the regression line for a given point.
How do you calculate the residual for a point on the regression line?
-You calculate the residual by subtracting the expected value (predicted by the regression line) from the actual observed value for a specific point.
What does a positive residual indicate?
-A positive residual indicates that the actual observed value is greater than the expected value predicted by the regression line.
What does a negative residual indicate?
-A negative residual indicates that the actual observed value is less than the expected value predicted by the regression line.
How is a residual plot constructed?
-A residual plot is constructed by plotting the residuals on the y-axis and the x-values of the data points on the x-axis. Each point on the plot represents the residual for a specific x-value.
Why are residual plots useful in regression analysis?
-Residual plots are useful because they help to assess the quality of the fit of the regression line. They can reveal trends or patterns in the residuals that might suggest a poor fit or the need for a non-linear model.
What does a random scattering of points in a residual plot suggest about the regression line?
-A random scattering of points in a residual plot suggests that the regression line is a good fit for the data, as there is no discernible pattern or trend in the residuals.
What type of trend in a residual plot might indicate a poor fit for the regression line?
-An upward or downward trend, or a pattern of curving up and then down in a residual plot, might indicate that the regression line is not a good fit for the data and that a non-linear model could be more appropriate.
How can the R value be related to the pattern observed in a residual plot?
-The R value, which measures the strength of the linear relationship between the variables, can be related to the pattern in a residual plot. A low R value, especially if combined with a clear pattern in the residuals, might indicate that the regression line is not a good fit for the data.
What does a large number of residuals far from the x-axis in a residual plot suggest?
-A large number of residuals far from the x-axis in a residual plot suggests that the regression line may not be a good fit for the data, as it indicates that many predicted values deviate significantly from the actual observed values.
Outlines
📊 Introduction to Residual Plots
This paragraph introduces the concept of a residual plot in the context of regression analysis. The instructor explains that a residual plot is used to visualize the differences (residuals) between the actual data points and the values predicted by a regression line. The explanation includes a step-by-step process of calculating residuals for given data points and plotting them on a graph. The purpose of a residual plot is to assess the quality of the fit of the regression line to the data. If the residuals appear to be randomly scattered without any discernible pattern, it suggests that the regression line is a good fit. However, if there is a noticeable trend in the residuals, it indicates that the line may not be a suitable model for the data, potentially necessitating a non-linear model.
📈 Evaluating Fit with Residual Plots
In this paragraph, the instructor further elaborates on the use of residual plots to evaluate the fit of a linear model. The discussion includes examples of how to interpret the plots. If the residuals are evenly scattered above and below the line, it suggests that the linear model is a good fit for the data. Conversely, if the residual plot shows a trend, such as a pattern of increase or decrease, or if there are many residuals far from the x-axis, it indicates that the linear model may not be appropriate. The instructor also mentions the R value, a statistical measure of how well the observed data fit a model, and suggests that a low R value in conjunction with a non-random residual plot would indicate a poor fit for the linear model.
Mindmap
Keywords
💡residual plot
💡regression
💡least squares
💡residual
💡fit
💡scatter
💡non-linear model
💡actual vs expected
💡R value
💡x-axis and y-axis
💡trend
Highlights
The video discusses the concept of a residual plot in the context of regression analysis.
A residual plot is used to visualize the difference between the actual and expected values from a regression line.
The residual for a point is calculated as the actual value minus the expected value.
A positive residual indicates that the actual value is above the regression line.
A negative residual indicates that the actual value is below the regression line.
A residual plot can help determine the quality of fit of a regression line to the data.
Randomly scattered residuals around the horizontal axis suggest a good fit of the regression line.
Systematic trends in the residual plot, such as a curve, indicate a poor fit for the linear model.
A non-linear model may be more appropriate if the residual plot shows a discernible trend.
Large residuals far from the x-axis in the residual plot also suggest a poor fit of the model.
The R value can be used to quantify the goodness of fit, with values closer to one indicating a better fit.
The example provided in the video demonstrates how to plot residuals for a given set of data points.
The video explains how to interpret a residual plot and what it indicates about the regression model's fit.
The video provides a clear and detailed explanation of the concept of residuals and their importance in regression analysis.
The video uses a step-by-step approach to illustrate how to calculate and plot residuals for a set of data points.
The video emphasizes the practical application of residual plots in assessing the suitability of a linear model for a given dataset.
The video's content is relevant for anyone looking to understand and apply regression analysis techniques.
Transcripts


5.0 / 5 (0 votes)
Thanks for rating: