Residuals and Residual Plots
TLDRThe video script discusses the concept of residuals and residual plots in the context of linear modeling. It explains that residuals are the differences between observed and predicted Y values, and residual plots visualize these differences. A random distribution of points in a residual plot suggests that a linear model is appropriate for the data, while a pattern indicates that a linear model may not be suitable. The script uses a hypothetical dataset and a least squares regression line to illustrate these concepts.
Takeaways
- 📈 The concept of a residual is the difference between the observed and predicted values (Y - ŷ) in a linear model.
- 📊 A residual plot is a graphical representation that displays the residuals against the X-values of the data points.
- 🤔 Residuals represent the 'leftovers' or the unexplained variation in the Y values after fitting a linear model.
- 🧩 Each data point's residual is the vertical distance from the point to the line of best fit, either above or below the line.
- 📐 The formula for calculating a residual is the observed Y minus the predicted Y (ŷ) from the line of best fit.
- 🔍 A residual plot helps in assessing the appropriateness of a linear model for a given data set.
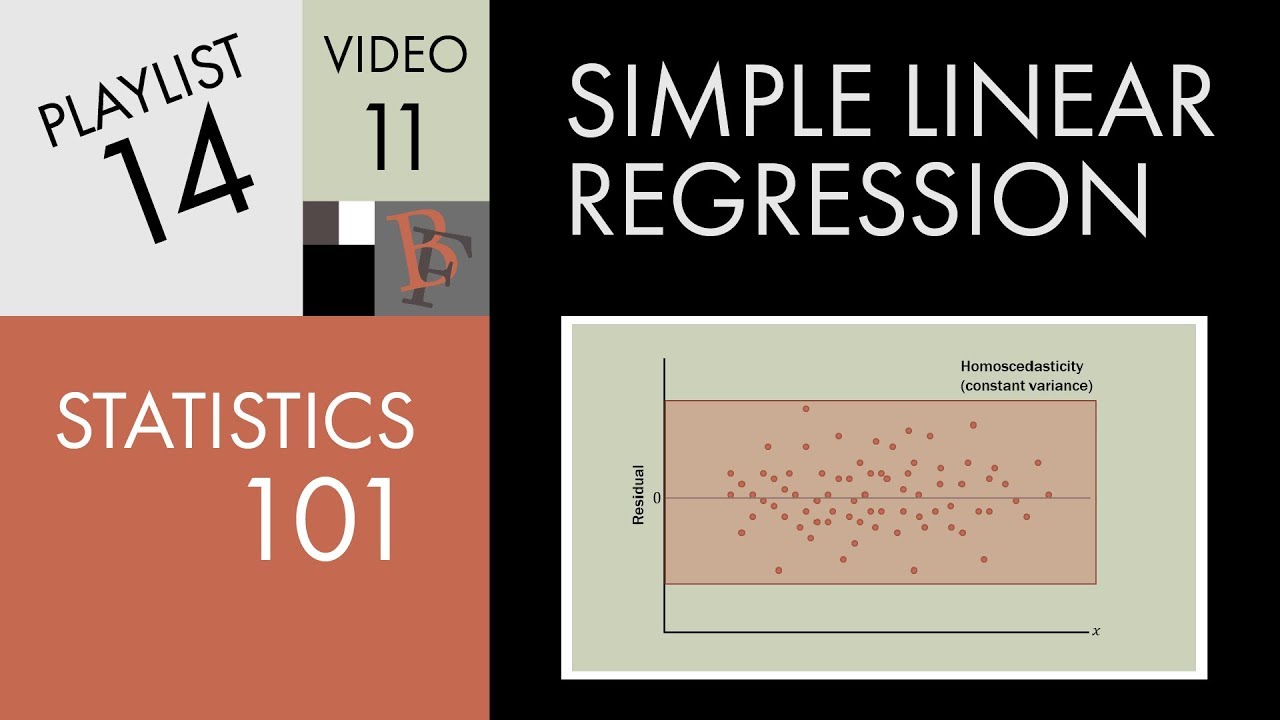
- 🟫 No discernible pattern in a residual plot, appearing as a random scatter, indicates a well-fit linear model.
- 🟥 Observed patterns in the residual plot suggest that a linear model may not adequately represent the data.
- 📈 The R value (0.57 in the example) indicates the strength and direction of the linear relationship but does not confirm the model's fit.
- 🔍 The process of finding residuals and plotting them helps in diagnosing the quality and assumptions of the linear model.
- 📚 The script provides examples and references to further resources for understanding the application of residual plots in data analysis.
Q & A
What is a residual in the context of a linear model?
-A residual is the difference between the observed Y value of a data point and the predicted Y value (y hat) from the line of best fit in a linear model.
How is a residual calculated?
-A residual is calculated by subtracting the predicted Y value (obtained from the line of best fit) from the observed Y value of a specific data point.
What does a residual plot represent?
-A residual plot represents the residuals (differences between observed and predicted Y values) on the vertical axis and the X values of the data points on the horizontal axis.
Why is a residual plot useful in evaluating a linear model?
-A residual plot is useful in evaluating a linear model because it can reveal patterns or trends that might indicate whether the model is a good fit for the data. No discernible pattern suggests a well-fitted linear model, while noticeable patterns suggest that a linear model may not be appropriate.
What does a chaotic jumble of points in a residual plot indicate about the linear model?
-A chaotic jumble of points in a residual plot indicates that the data can be reasonably modeled by a linear model, as there is no discernible pattern that deviates from randomness.
What is the significance of an R value in the context of linear regression?
-The R value in linear regression represents the strength and direction of the linear relationship between the variables. An R value of 0.507 suggests a positive but moderate linear relationship.
How does the appearance of a normal probability plot relate to the normality of a data set?
-In a normal probability plot, if the points fall close to a straight line, it suggests that the data set is normally distributed. The closer the fit, the more normal the distribution is considered to be.
What is the purpose of comparing a residual plot to a normal probability plot?
-Both residual plots and normal probability plots are used to assess the appropriateness of a statistical model. While a normal probability plot assesses the normality of a distribution, a residual plot evaluates the fit of a linear model to the data.
What might the presence of a pattern in a residual plot suggest about the data and the linear model?
-If a pattern is observed in the residual plot, it suggests that the linear model is not an appropriate representation of the data, as there are systematic deviations between the observed and predicted values.
How many points were used to create the example residual plot in the script?
-Initially, it was mentioned that there were six points, but later it was corrected to seven points being used for the example residual plot.
What is the equation of the line of best fit provided in the script?
-The specific equation of the line of best fit is not provided in the script; however, it is mentioned that such an equation exists and is used to calculate the predicted Y values (y hat).
Outlines
📊 Introduction to Residuals and Residual Plots
This paragraph introduces the concept of residuals and residual plots in the context of linear modeling. A residual is defined as the difference between the observed Y values and the predicted Y values (Y hat) from the line of best fit. The speaker illustrates this with a fabricated dataset and explains how residuals can be calculated for each data point. The purpose of a residual plot is then described as a tool to assess the quality of the linear model fit to the data. The speaker emphasizes that if the residual plot appears random and without pattern, it indicates that the linear model is a good fit, but any discernible pattern suggests that a linear model may not be appropriate.
📈 Analyzing Residual Patterns in Linear Modeling
The second paragraph delves deeper into the analysis of residual plots. The speaker recalls the concept of normal probability plots from a previous chapter and draws a parallel, explaining that the goal is to determine if the data is well-represented by a linear model. The R value of 0.507 indicates a moderate positive linear relationship, supporting the use of a linear model. However, the residual plot provides additional insights. The speaker clarifies that a residual plot without any pattern indicates a good fit of the linear model to the data, while any pattern observed suggests that a linear model may not accurately represent the data. The speaker promises further examples and discussion in the book to aid understanding.
Mindmap
Keywords
💡Residual
💡Line of Best Fit
💡Residual Plot
💡Least Squares Regression
💡Scatter Plot
💡Normal Distribution
💡Linear Relationship
💡R Value
💡Predicted Y (y hat)
💡Observed Y
💡Pattern in Residual Plot
Highlights
The concept of a residual is introduced as what's left over in terms of the Y values from a model.
A residual plot is used to analyze the performance of a linear model by examining the residuals.
The formula for calculating a residual is the observed Y value minus the predicted Y value from the line of best fit.
A residual plot is created by plotting the X coordinates of data points against their corresponding residuals.
The purpose of a residual plot is to determine if a linear model is a good representation of the data.
An R value of 0.507 indicates a positive and moderate linear relationship between the variables.
A residual plot with no discernible pattern suggests that the data can be reasonably modeled by a linear model.
A residual plot that displays a pattern indicates that a linear model may not be appropriate for the data set.
The vertical distance from a data point to the line of best fit represents the residual for that point.
Residuals are calculated by taking the difference between the observed Y value and the predicted Y value from the line of best fit.
The horizontal axis of a residual plot uses the same scale as the scatter plot, based on X values.
The vertical axis of a residual plot uses a different scale and represents the residual data.
Normal probability plots are used to determine if a data set is modeled by a normal distribution.
A straight line in a normal probability plot indicates a more normal distribution.
Residual plots serve a similar purpose to normal probability plots but are used for linear models instead of normal distributions.
A chaotic jumble of points in a residual plot indicates a good fit for the linear model.
Transcripts
Browse More Related Video

Residual plots | Exploring bivariate numerical data | AP Statistics | Khan Academy

interpreting residual graphs

How to Calculate the Residual

10.2.6 Regression - Residual Plots and Their Interpretation

Calculating Residuals & Making Residual Plots on TI-84 Plus
Statistics 101: Linear Regression, Residual Analysis
5.0 / 5 (0 votes)
Thanks for rating: