How to Calculate the Residual
TLDRThis video script introduces the concept of residuals in the context of linear regression analysis. A residual is defined as the difference between the observed data value and the value predicted by the model. The script explains how to calculate residuals using the formula: residual = observed - predicted. It also discusses how to interpret residuals in relation to the model's accuracy, with positive residuals indicating an underestimation and negative residuals indicating an overestimation. The process of calculating residuals is demonstrated using a blood-alcohol content example, where the observed values are compared against the predictions made by the regression line. The steps include finding the observed value from the dataset, determining the predicted value using the regression equation, and then calculating the residual. The video emphasizes the importance of understanding residuals for evaluating the fit of a linear model to data.
Takeaways
- 📝 A residual is the difference between the observed and predicted values in a linear regression model.
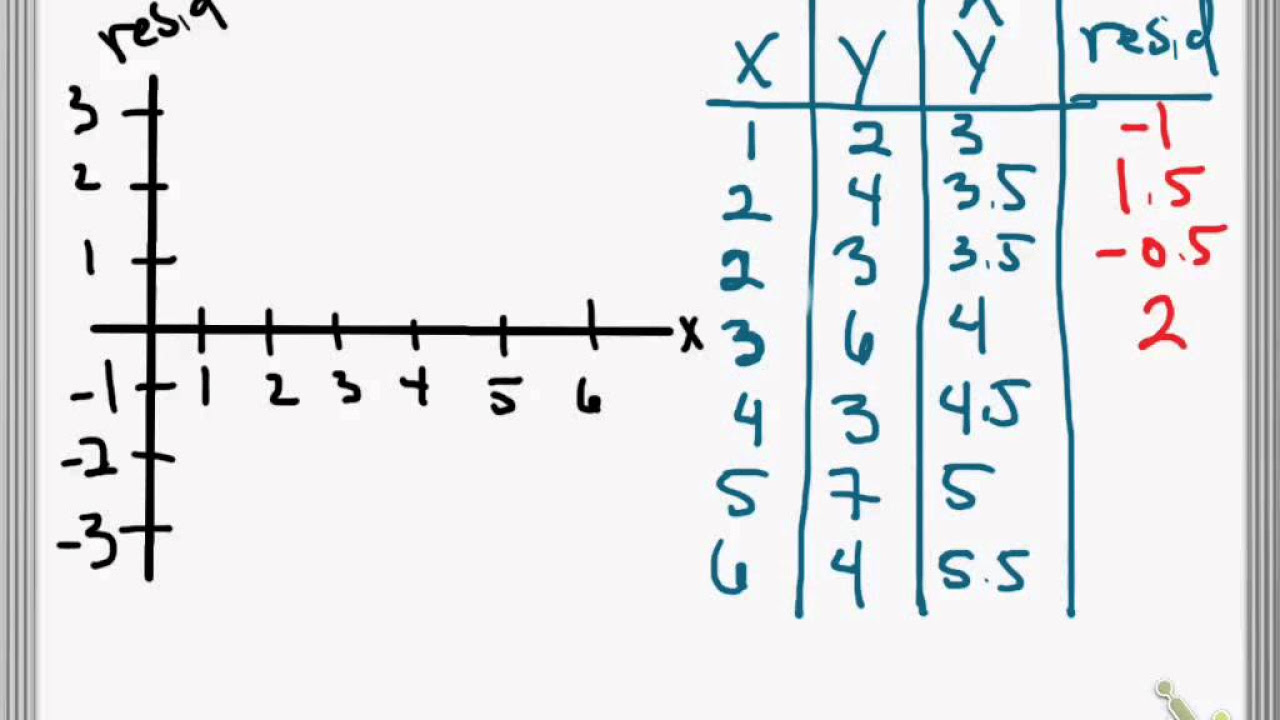
- 🔍 Residuals can be calculated using the formula: Residual = Observed - Predicted.
- 📊 Positive residuals indicate that the linear model is an underestimate of the actual value, while negative residuals suggest an overestimate.
- 🍶 The example used in the video involves blood-alcohol content versus the number of beers consumed.
- 🔢 To calculate a residual, one must first identify the observed value from the dataset, then find the predicted value using the linear model's equation.
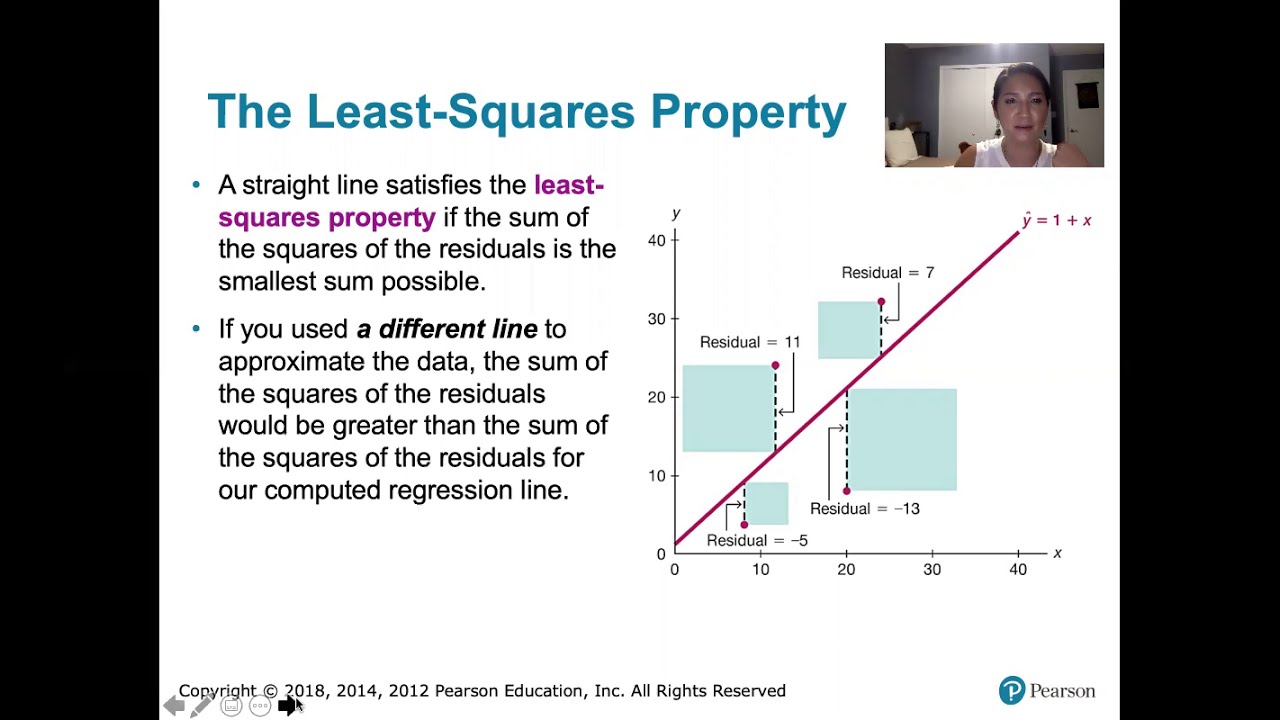
- 🎯 The vertical distance between a data point and the regression line on a scatterplot represents the residual for that point.
- 📈 The linear model's accuracy can be visually assessed by comparing the scatterplot to the regression line.
- 👀 Each data point will have a unique residual, reflecting how well the model fits that specific observation.
- 📝 When there are multiple data points for a single x-value, the instructor must specify which one to use for residual calculation.
- 🛠️ The process of calculating residuals involves three steps: finding the observed value, calculating the predicted value, and then applying the residual formula.
- 📋 The video script serves as an educational tool to help viewers understand and calculate residuals in a linear regression context.
Q & A
What is the definition of a residual in the context of statistics?
-In statistics, a residual is the difference between the observed data value and the value predicted by a model, more formally defined as observed minus predicted.
What does the term 'residual' imply in everyday language?
-In everyday language, 'residual' refers to what is leftover after a process or an event has taken place.
How can you tell if a linear model is overestimating or underestimating the actual values?
-You can tell if a linear model is overestimating or underestimating the actual values by looking at the scatterplot with the line of best fit. A positive residual indicates an underestimate, while a negative residual indicates an overestimate.
What is the equation used to calculate the residual for a given data point?
-The equation used to calculate the residual for a given data point is residual = observed value - predicted value.
What is the significance of understanding residuals in data analysis?
-Understanding residuals is crucial in data analysis as it helps in assessing the accuracy and reliability of a model. It indicates how well the model fits the data and where improvements might be needed.
How does the process of calculating a residual for a data point begin?
-The process of calculating a residual begins by identifying the observed Y value from the dataset corresponding to the specific X value of interest.
What is the next step after finding the observed value?
-After finding the observed value, the next step is to calculate the predicted value by substituting the appropriate X value into the regression equation and solving for Y.
What is the final step in calculating a residual?
-The final step in calculating a residual is to substitute both the observed value and the predicted value into the residual equation (residual = observed - predicted) to find the actual residual for that data point.
In the provided transcript, what was the residual for the data point where x equals nine beers?
-The residual for the data point where x equals nine beers was a blood alcohol content of 0.040.
How does the sign of the residual (positive or negative) relate to the performance of the linear model?
-A positive residual indicates that the linear model has underestimated the actual value, while a negative residual indicates that the model has overestimated the actual value.
What is the residual for the data point where x equals eight beers, as mentioned in the transcript?
-The residual for the data point where x equals eight beers is a blood alcohol content of negative 0.011.
Outlines
📊 Introduction to Residuals and Their Calculation
This paragraph introduces the concept of residuals in the context of linear regression analysis. It explains that residuals represent the discrepancy between the actual data points and the predicted values from the model. The residual is defined as the observed value minus the predicted value. The paragraph uses the example of blood-alcohol content versus the number of beers consumed to illustrate how residuals are calculated and how they can indicate whether the model is overestimating or underestimating the true values. The process of calculating residuals is broken down into steps: identifying the observed value from the data set, finding the predicted value using the regression equation, and then determining the residual by subtracting the predicted value from the observed value.
📐 Calculating Residuals for Specific Data Points
This paragraph delves deeper into the process of calculating residuals for specific data points, using the continuation of the blood-alcohol content example. It provides a step-by-step guide on how to find the observed and predicted values for a given x-value, and then how to calculate the residual. The paragraph emphasizes the importance of consulting the data set to find the exact observed values and using the regression equation to determine the predicted values. It also explains how to interpret the residuals: a positive residual indicates that the model underestimates the actual value, while a negative residual suggests an overestimation. The example calculations for x equals eight and nine beers demonstrate these concepts, showing how the residual can vary depending on the data point being considered.
Mindmap
Keywords
💡Residual
💡Linear Equation
💡Overestimate
💡Underestimate
💡Observed Value
💡Predicted Value
💡Data Point
💡Regression Line
💡Scatterplot
💡Best Fit
💡Statistical Model
Highlights
The video explains how to calculate a residual.
Residual is the difference between the actual data value and the model predicted value.
In statistics, residual is defined as observed minus predicted.
The video uses the example of blood-alcohol content versus the number of beers.
Data points rarely lie exactly on the regression line.
The vertical distance between a data point and the regression line is the residual.
For a specific data point, the model can be either an underestimate or an overestimate.
Multiple data points can exist for a single value of x.
To calculate the residual, first find the observed Y value from the data set.
Predicted value is found by substituting the x value into the equation.
The residual is calculated using the equation: residual = observed - predicted.
Positive residual indicates the model underestimates the actual value.
Negative residual indicates the model overestimates the actual value.
The video demonstrates how to find the observed and predicted values for a specific data point.
The process of calculating residuals is shown step by step in the video.
The video concludes by reinforcing the ability to calculate residuals and understand the model's accuracy.
Transcripts


5.0 / 5 (0 votes)
Thanks for rating: