Residual Plot on TI-84 Plus
TLDRThis video tutorial demonstrates how to create a residual plot on a graphing calculator, emphasizing the importance of having data entered and a linear regression model calculated. It guides viewers through the process of checking data in lists L1 and L2, using the calculator's statistical features to perform linear regression and generate residuals. The video then instructs on plotting these residuals against the X values from the data, to evaluate the fit of the linear model. The final step involves adjusting the graph settings to display the residual plot without the line of best fit, allowing for an assessment of the model's appropriateness. The clear and concise explanation is aimed at viewers with a basic understanding of statistics and algebra.
Takeaways
- 📊 Familiarize yourself with the stat menu and data entry process on the graphing calculator for statistical analysis.
- 📈 Ensure your data is correctly entered in lists L1 and L2 before proceeding with residual plot creation.
- 🔍 Verify that a stat scatter plot has been created to visualize the data points and their distribution.
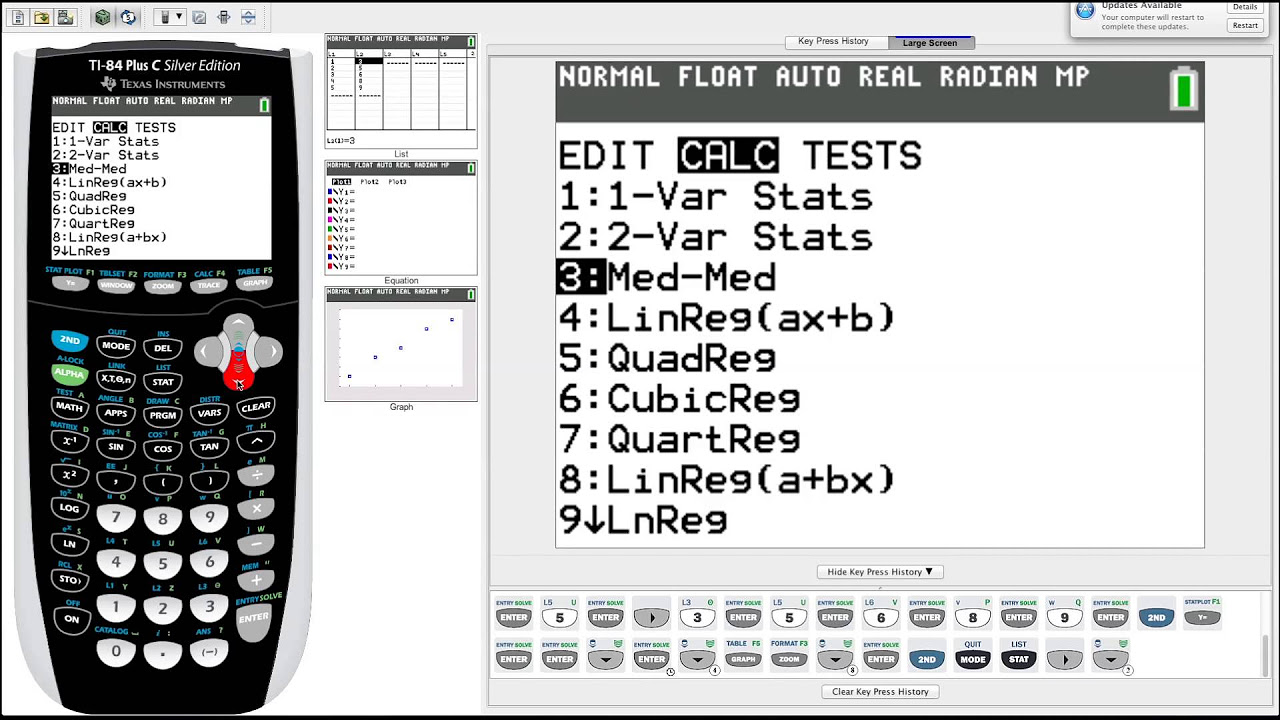
- 📝 Understand the necessity of a linear regression model (using option 8 for the format) for calculating residuals.
- 👁️ Use the calculator's summary statistics to obtain the y-intercept, slope, coefficient of determination, and correlation.
- 🔢 Store the linear regression equation in Y1 for easy reference and analysis using tables and graph menu.
- 🧩 Access the list of residuals by navigating to the stat menu and selecting option number seven.
- 📊 To create a residual plot, adjust the graphing calculator's stat plot menu to use the residuals list (option number seven) instead of the original Y values.
- 🚫 Turn off the line of best fit in the residual plot by editing the Y= equation to simply press enter.
- 📊 The residual plot should have a sum of residuals close to zero, which is an indicator of the model's fit.
- 🤔 Use the residual plot to assess the appropriateness of the linear fit for the given data set.
Q & A
What is the primary purpose of the video?
-The primary purpose of the video is to demonstrate how to create a residual plot on a graphing calculator.
Where should the data for the residual plot be entered on the calculator?
-The data for the residual plot should be entered in lists L1 and L2 on the calculator.
How can you check if your data is correctly entered and plotted?
-You can check if your data is correctly entered and plotted by hitting 'zoom 9' to view your scatter plot of the data.
What is required before creating a residual plot?
-A linear regression model is required before creating a residual plot, as residuals are calculated based on this model.
Which option should be used for the linear regression model in a statistics class?
-In a statistics class, option 8 should be used for the linear regression model where the constant is placed first followed by the x term.
How do you store the linear regression equation on the calculator?
-The linear regression equation is typically stored in Y1 by using the 'vars' button, going to the right, hitting 'Y vars', and then 'Y equals'.
What statistics are provided after calculating the linear regression model?
-After calculating the linear regression model, you are provided with summary statistics including the Y-intercept, slope, coefficient of determination, and correlation.
How can you view the list of residuals on the calculator?
-You can view the list of residuals on the calculator by hitting the 'second' button, then 'stat', and selecting option number seven.
What change needs to be made to the Y list when plotting a residual plot?
-When plotting a residual plot, the Y list should be changed from the individual values of Y to the residuals.
How do you remove the line of best fit from the residual plot?
-To remove the line of best fit from the residual plot, you can go into the 'Y equals' menu, tap on the equal sign, and hit enter.
What can the residual plot help you determine?
-The residual plot can help you determine whether or not the linear fit is appropriate for the data.
Outlines
📊 Creating a Residual Plot on a Graphing Calculator
This paragraph explains the process of creating a residual plot using a graphing calculator. It begins by emphasizing the importance of having data entered in the stat menu and having a stat scatter plot prepared. The speaker then guides the viewer through the steps of performing a linear regression by accessing the calc option and choosing the appropriate settings for the algebra or statistics class. The paragraph further discusses the storage of the regression equation in y1 for easy reference and analysis. The summary statistics obtained from the calculator, including the y-intercept, slope, coefficient of determination, and correlation, are explained. Finally, the paragraph details how to view and plot the list of residuals, and how to adjust the stat plot menu to graph the residual plot, including turning off the line of best fit for clearer analysis.
Mindmap
Keywords
💡residual plot
💡graphing calculator
💡data entry
💡linear regression model
💡scatter plot
💡residuals
💡y-intercept
💡slope
💡coefficient of determination
💡correlation
💡list L1 and L2
💡zoom 9
Highlights
The video demonstrates how to create a residual plot on a graphing calculator.
Ensure data is entered in the stat menu, specifically in lists L1 and L2.
Verify that a stat scatter plot has been created for quick data visualization.
A linear regression model is necessary for creating a residual plot.
For a typical algebra class, use the y = mx + b form, while statistics often use the form with the constant first.
Store the linear regression equation in Y1 for easy access and analysis.
The calculator provides summary statistics including the y-intercept, slope, coefficient of determination, and correlation.
The calculator automatically generates a list of residuals based on the entered data.
View the list of residuals by accessing the stat menu and selecting option number seven.
To plot the residuals, change the Y list in the stat plot menu from individual y values to the residuals list.
After plotting, the line of best fit may still appear and can be removed by editing the Y= equation.
The residual plot allows for the assessment of the appropriateness of the linear fit.
The process may seem tedious but is essential for working with graphing calculators in statistical analysis.
The video provides a step-by-step guide, making it accessible for users to follow along and apply to their own data.
The use of the calculator for statistical analysis is a practical application in algebra and statistics classes.
The video concludes by thanking the viewers for their attention, emphasizing the value of the information shared.
Transcripts
Browse More Related Video

Calculating Residuals & Making Residual Plots on TI-84 Plus

How to Calculate the Residual
TI-84 Plus Graphing Calculator Guide: Statistics

Residual plots | Exploring bivariate numerical data | AP Statistics | Khan Academy

Pre-Calculus - Find the linear regression line using the TI-83/84 calculator (2)
Statistics 101: Linear Regression, Residual Analysis
5.0 / 5 (0 votes)
Thanks for rating: