interpreting residual graphs
TLDRThe video script discusses the concept of residuals in the context of least squares regression analysis. It explains how residuals, represented as the vertical distance from data points to the regression line, can indicate the fit of the model. A random scatter of residuals suggests a good fit, while patterns such as a curved relationship or increasing scatter with the X values indicate that a linear model may not be suitable. The script emphasizes the importance of examining residual plots to assess the linearity assumption and the predictive accuracy of the model, especially for varying ranges of the independent variable.
Takeaways
- 📈 Understanding residuals is crucial in assessing the fit of a least squares regression line.
- 🎯 A random scatter of residuals around the horizontal line (zero) indicates a good fit and supports the linearity assumption.
- 🚫 A curved pattern in the residual plot suggests a non-linear relationship, indicating that a polynomial model may fit better than a linear one.
- ⚠️ A linear model may be suitable for smaller X values but not for larger ones if there's increased scatter in the residuals as X increases.
- 🔍 Part B of the script highlights the importance of examining the entire range of data to determine the appropriateness of the linear model.
- 📊 Residual plots for different data sets can reveal different patterns, each suggesting a particular type of regression model that might be more appropriate.
- 🌐 In Part C, the regression line has a good fit initially but fails to predict accurately at higher X values due to increased scatter.
- 🔢 Large magnitude residuals signify higher errors between actual and predicted values, questioning the accuracy of the model.
- 👀 Identifying patterns in residual graphs is essential for model validation and improvement.
- 🛠️ The script emphasizes the need to adjust the model when residuals indicate a poor fit or a non-linear relationship.
- 📉 A decrease in error as X values increase, as mentioned in Part A, might suggest a better fit for the model in a specific range of data.
Q & A
What is the purpose of a least squares regression line in analyzing data?
-The least squares regression line is used to find the line of best fit for a set of data points. It helps in understanding the relationship between variables by minimizing the sum of the squares of the residuals, which are the differences between the observed and predicted values. This line serves as a model for the data, allowing for predictions and analysis of the relationship's strength and direction.
How do residuals help in assessing the fit of a regression line?
-Residuals, which represent the vertical distance between each data point and the regression line, are crucial in evaluating the fit of the model. Random scatter of residuals around the horizontal axis of a residual plot indicates a good fit, as it suggests that the line of best fit is effectively capturing the pattern in the data. Non-random patterns, such as curves or trends in the residuals, suggest that the model may not be appropriate and that the data might be better described by a non-linear model or a different transformation.
What does a positive residual indicate in the context of a regression line?
-A positive residual indicates that the observed data point is above the regression line. This means that the actual value of the dependent variable is higher than the value predicted by the regression model for that specific point in the independent variable.
What does a negative residual indicate in the context of a regression line?
-A negative residual indicates that the observed data point is below the regression line. This means that the actual value of the dependent variable is lower than the value predicted by the regression model for that specific point in the independent variable.
Why is it important for the residuals to sum up to zero in a least squares regression analysis?
-The sum of the residuals always equals zero in a least squares regression analysis because the line of best fit is designed to minimize the sum of the squared residuals. This property ensures that the line is positioned in such a way that it equally balances the discrepancies above and below the line, leading to the most accurate representation of the data points.
What does a curved pattern in a residual plot suggest about the data?
-A curved pattern in a residual plot suggests that the data may not be well-fit by a linear model. It indicates that there could be a non-linear relationship between the variables, and a polynomial or other non-linear model might provide a better fit.
How can the magnitude of residuals inform us about the accuracy of the regression model?
-The magnitude of residuals provides insight into the accuracy of the regression model. Larger residuals indicate a greater difference between the observed and predicted values, suggesting a higher degree of error and a poorer fit of the model to the data. Conversely, smaller residuals suggest a better fit and more accurate predictions.
What does it mean if there is a random scatter of residuals across the least squares regression line?
-A random scatter of residuals across the least squares regression line is a desirable outcome. It suggests that the model has adequately captured the underlying pattern in the data, and the residuals are not systematically biased in any particular direction. This randomness indicates that the line of best fit is a good representation of the data, and the model assumptions, including linearity, are not contradicted by the data.
What happens when residuals show a pattern that changes as the independent variable increases?
-If residuals show a pattern that changes as the independent variable increases, it may indicate that the relationship between the variables is not constant and could be better described by a more complex model. For example, a decrease in residuals' magnitude initially followed by an increase for larger values of the independent variable might suggest that the model is a good fit for smaller values but not for larger ones, questioning the model's suitability for prediction across the entire range of data.
How can we interpret a residual plot with a large number of points above and below the line, but no clear pattern?
-A residual plot with a large number of points above and below the line, but no clear pattern, can be interpreted as a random distribution of residuals. This randomness might suggest that the model has captured the underlying relationship adequately, but it's essential to examine the residuals' magnitude and whether they are uniformly distributed. If the residuals are not uniformly distributed, it could indicate issues with the model's fit or the presence of other underlying relationships not captured by the linear model.
Why is it necessary to check the distribution of residuals when evaluating a regression model?
-Checking the distribution of residuals is necessary because it helps to validate the assumptions of the regression model, particularly the assumption of homoscedasticity and the absence of autocorrelation. A proper distribution of residuals can indicate that the model's assumptions are met, and the model is reliable for making predictions and inferences. Any deviation from the expected distribution, such as patterns or trends, can point to potential issues with the model, such as non-linearity, heteroscedasticity, or other complexities in the data that the current model does not account for.
Outlines
📊 Analyzing Residuals and Linearity in Regression Analysis
This paragraph discusses the concept of residuals in the context of least squares regression line creation using Minitab. It explains how to interpret residual graphs, with a focus on identifying patterns in the data points' distribution relative to the regression line. The paragraph outlines three different scenarios: a random scatter indicating a good fit for the linear model, a curved pattern suggesting a polynomial relationship, and increasing scatter with larger X values indicating a poor fit for the linear model. The importance of residuals in assessing the suitability of the linear model is emphasized.
Mindmap
Keywords
💡Residuals
💡Least Squares Regression Line
💡Random Scatter
💡Linear Assumption
💡Curved Relationship
💡Polynomial Relationship
💡Model Fit
💡Predictor
💡X Direction
💡Error
Highlights
Discussion on residuals and their importance in regression analysis.
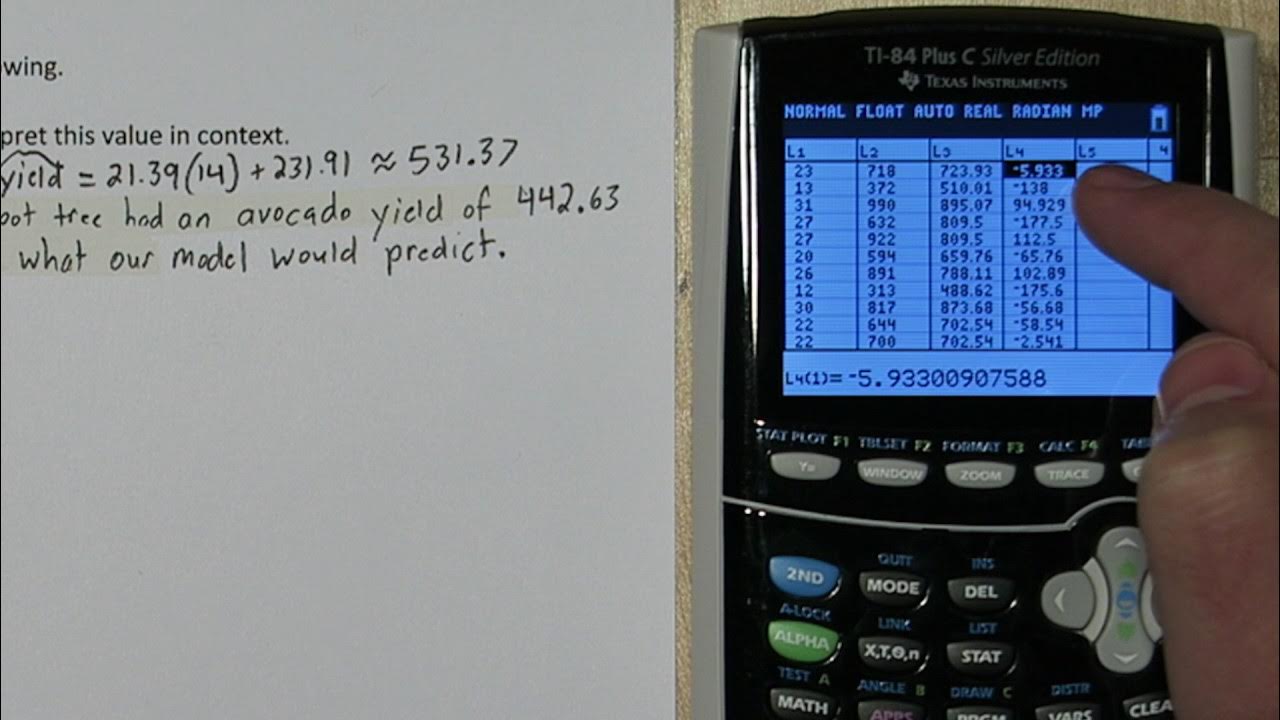
Explanation of creating a least squares regression line in Minitab.
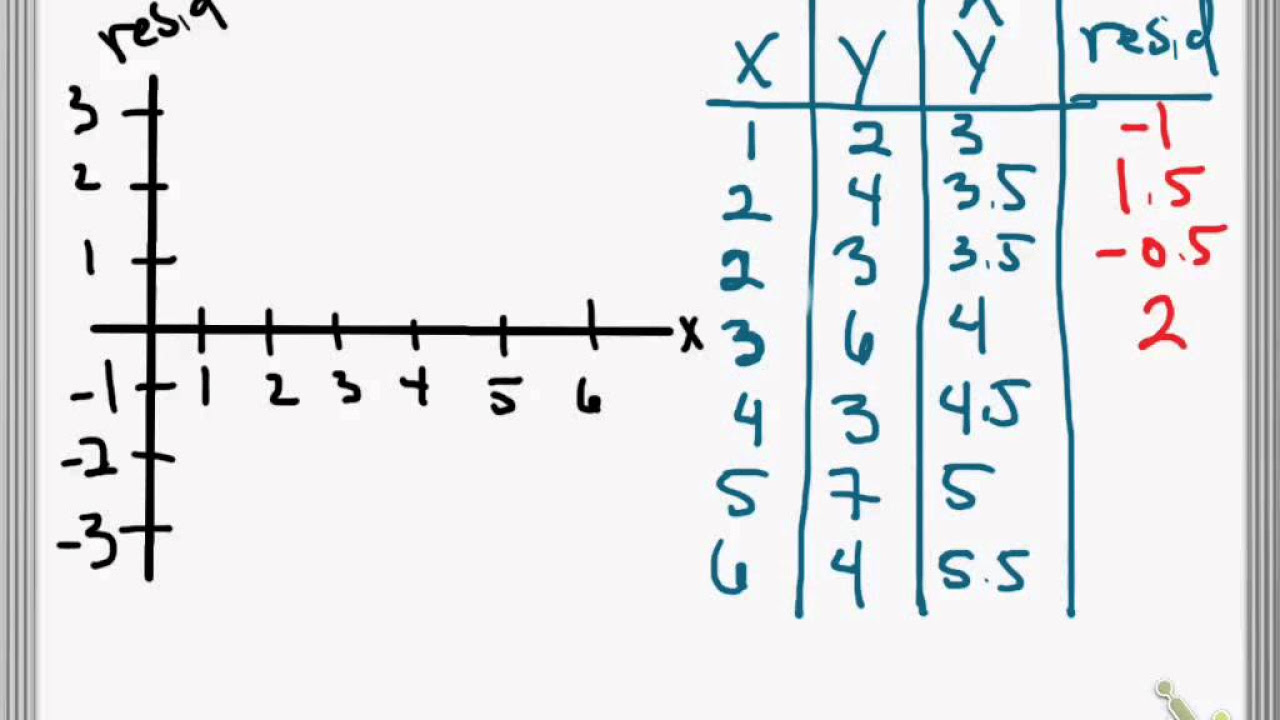
Interpretation of positive and negative residuals in relation to the regression line.
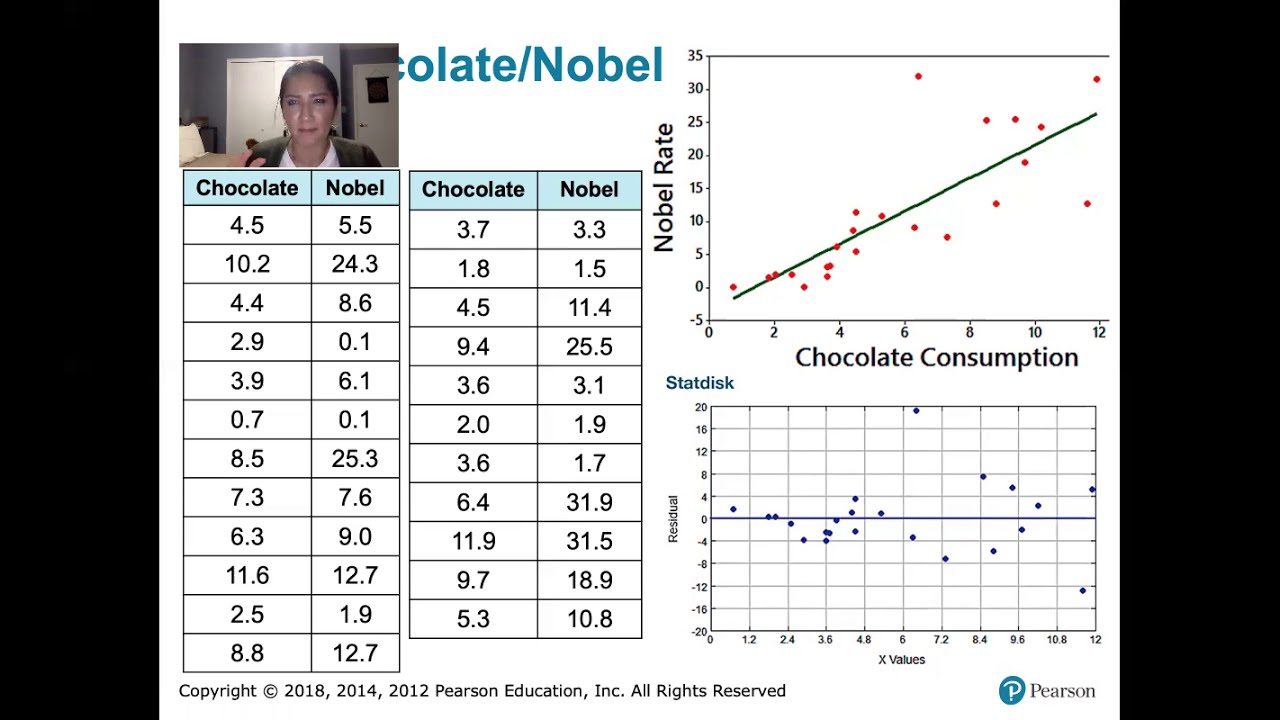
Analysis of a residual graph with a random scatter indicating a good fit for the linear model.
Identification of a curved pattern in residual graphs suggesting a non-linear relationship.
Discussion on the potential need for a polynomial relationship when a curved pattern is observed.
Evaluation of linear model's effectiveness for small versus large X values based on scatter.
Critique of linear model's predictive power when residuals show a significant increase in magnitude.
Assessment of the linear model's accuracy in relation to the distribution of residuals.
Observation of a reverse pattern in residual scatter indicating a potential issue with the linear model.
Insight on the impact of large residuals on the accuracy of predictions.
Discussion on the improvement of the linear model's fit with increasing X values.
Analysis of the suitability of the linear model based on the pattern and magnitude of residuals.
Explanation of how to interpret residual graphs to determine the effectiveness of a regression model.
Transcripts
Browse More Related Video

Residual plots | Exploring bivariate numerical data | AP Statistics | Khan Academy
Residuals and Residual Plots
Calculating Residuals & Making Residual Plots on TI-84 Plus

RESIDUALS! What are they? how to find them, how to use them
10.2.6 Regression - Residual Plots and Their Interpretation
Introduction to residuals and least squares regression
5.0 / 5 (0 votes)
Thanks for rating: