Log normal distribution | Math, Statistics for data science, machine learning
TLDRThe video script explains the concept of log normal distribution, contrasting it with normal distribution. It uses examples such as people's income and hospitalization days to illustrate how applying a log function can transform a right-skewed distribution into a normal one. The script also discusses the practical application of log transformation in data science, particularly in machine learning models for credit risk analysis, emphasizing its importance in improving model accuracy by normalizing data scales.
Takeaways
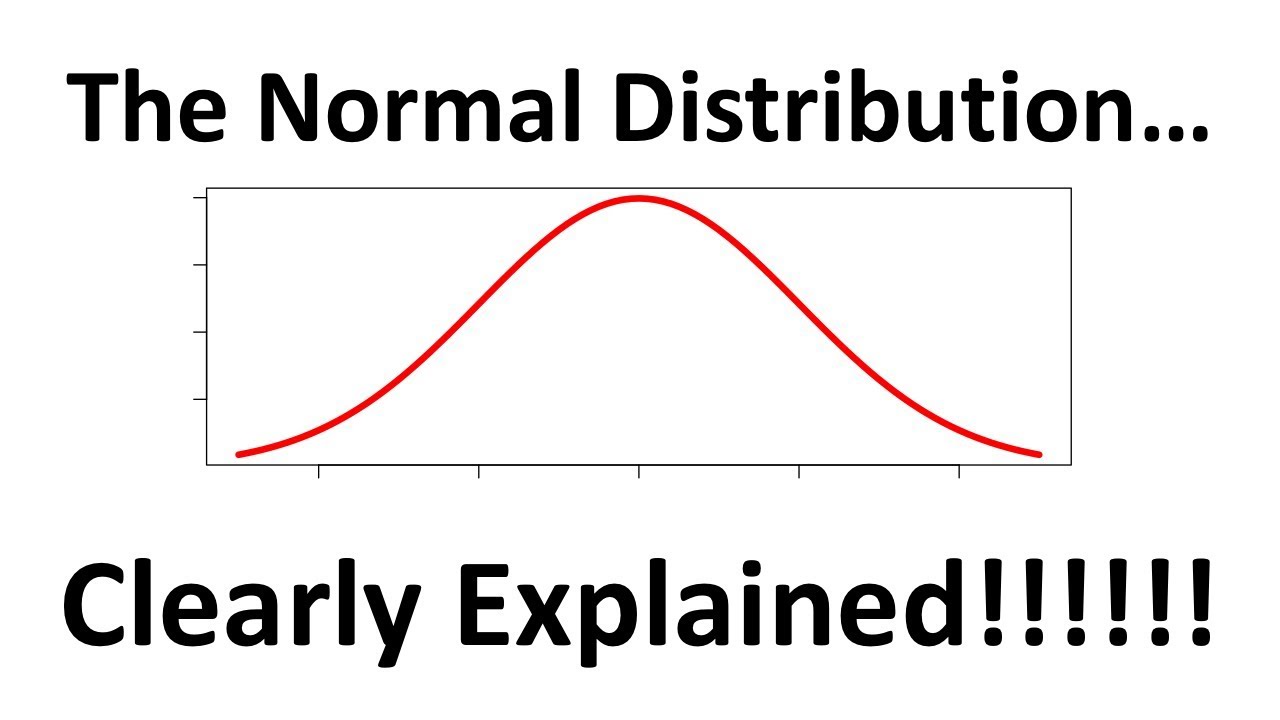
- 📈 The normal distribution is characterized by a bell curve shape, commonly seen in real-life examples like test scores and employee performance.
- 💰 People's income often follows a right-skewed distribution with a long tail at the higher end, unlike the symmetrical bell curve of normal distribution.
- 🔄 Applying a log function to the x-axis of a right-skewed income distribution can transform it into a normal distribution, creating a log-normal distribution.
- 🏥 Other examples of log-normal distributions include hospitalization days and advertising budgets, where there's a wide range of values but a typical central tendency.
- 🤖 In data science, log transformation is useful for machine learning models, especially when dealing with variables that have a log-normal distribution, to improve model accuracy.
- 📊 A log-normal distribution can be visualized using a bar plot in Python with the help of libraries like Cufflinks, which can plot data from a pandas DataFrame.
- 📈 When plotting income data, excluding the extremely high values can help in visualizing the log-normal distribution without the long tail effect.
- 🌐 The U.S. income dataset used in the example was sourced from the census.gov website, showing a simplified version with income ranges and counts.
- 🔧 Log transformation adjusts the scale of data to make it more uniform and comparable, which is beneficial for machine learning algorithms.
- 📚 Understanding log-normal distribution is crucial for data scientists as it's frequently encountered in real-world data and can impact the performance of predictive models.
- 🎯 In credit risk analysis or loan approval scenarios, log transformation can help in assessing the risk of lending to individuals with vastly different income levels.
Q & A
What is a normal distribution and how is it represented in a histogram?
-A normal distribution, also known as Gaussian distribution, is a probability distribution where all outcomes are equally likely and symmetrically distributed around the mean. In a histogram, it is represented by a bell curve, which is a graph showing that the majority of the data points cluster around the mean, with fewer data points as you move towards the extremes.
Can you provide real-life examples of normal distribution?
-Real-life examples of normal distribution include test scores, employee performance ratings, and measurements like height and weight for a large population, where the values tend to be clustered around an average with less frequency at the extremes.
What is the difference between a normal distribution and a log-normal distribution?
-A log-normal distribution is a distribution whose logarithm results in a normal distribution. It is used when the data is skewed to the right and the values can span several orders of magnitude, such as income distribution or hospitalization days. In contrast, a normal distribution is symmetrical and has a more uniform spread around the mean.
Why does the income distribution of people appear skewed in the US?
-The income distribution in the US appears skewed because most people have incomes around a common value (e.g., $50,000), but there are a few individuals, like Jeff Bezos and Elon Musk, who have significantly higher incomes, leading to a right-skewed distribution. This is different from a normal distribution where the data is more evenly distributed around the mean.
How does applying a log function to the x-axis transform a skewed distribution?
-Applying a log function to the x-axis compresses the higher values and spreads out the lower values, which can transform a right-skewed distribution into a more symmetrical, bell-shaped curve that resembles a normal distribution. This is because the log function is particularly effective at handling data with a wide range of values.
What is the significance of a log-normal distribution in data science?
-In data science, understanding log-normal distributions is crucial because they are common in various real-world phenomena. Recognizing and correctly handling log-normal data can improve the performance of machine learning models, especially when the data is used as a feature and the model's accuracy is affected by the scale of the data.
How can a log transformation help in building a machine learning model for credit risk analysis?
-A log transformation can help in building a machine learning model for credit risk analysis by normalizing the scale of the data, particularly the income of individuals. This transformation ensures that the model's independent variable falls within a similar range, which can enhance the model's predictive accuracy since machine learning models generally perform better when the input variables are on a similar scale.
What is the role of the log transformation in handling data with a long tail?
-The log transformation is particularly useful for handling data with a long tail, which is characteristic of right-skewed distributions. By compressing the scale of values at the high end and elevating the lower values, the log transformation can make the data more symmetrical and better suited for analysis, reducing the impact of extreme values on the model.
How can you identify a log-normal distribution in data?
-To identify a log-normal distribution, you can plot the data on a histogram and observe if it is right-skewed. If the plot shows a long tail on the right side, it may indicate a log-normal distribution. Applying a log transformation to the data and observing if the transformed data now follows a normal distribution can confirm this identification.
What is the practical application of understanding log-normal distribution in data analysis?
-Understanding log-normal distribution is essential in data analysis because it allows analysts to preprocess and transform data effectively for better model performance. It is particularly useful in scenarios like credit risk analysis, where handling variables with a wide range of values is critical for accurate predictions.
How can you visualize a log-normal distribution using Python and the Cbond library?
-You can visualize a log-normal distribution using Python and the Cbond library by loading the data into a pandas dataframe, applying the log transformation to the income column, and then plotting the data using the Cbond library's bar plot function. This will show the transformed data in a format that resembles a normal distribution, especially when the log of the income is plotted against the count of individuals in each income bracket.
Outlines
📊 Introduction to Normal and Log-Normal Distributions
This paragraph introduces the concept of normal distribution using the example of people's highest database plotted on a histogram, which forms a bell curve. It explains that normal distribution is common in real-life examples such as test scores and employee performance. The paragraph then contrasts this with people's income database, which is right-skewed and not normally distributed due to the presence of extremely high earners like Jeff Bezos and Elon Musk. It demonstrates how applying a log function to the x-axis of the income data can transform the right-skewed distribution into a normal distribution, thus creating a log-normal distribution. The importance of this transformation in data science and machine learning is highlighted, particularly in credit risk analysis and loan approval prediction models.
📈 Data Visualization and Log-Normal Distribution in Practice
The second paragraph delves into the practical application of log-normal distribution in data visualization. It describes the creation of a simplified dataset based on U.S. income data, focusing on income ranges and their respective counts. The use of the pandas library in Python to load the data into a dataframe and the seaborn library to plot a bar chart is explained. The paragraph emphasizes the visual transformation of the data when the log function is applied to the x-axis, resulting in a distribution that closely resembles a bell curve. The summary also mentions other examples of log-normal distributions, such as hospitalization days and advertising budgets, and encourages the application of log transformation to improve machine learning model accuracy when dealing with skewed data. The video description provides a link to the code used for this demonstration.
Mindmap
Keywords
💡Normal Distribution
💡Log Normal Distribution
💡Histogram
💡Skewness
💡Log Function
💡Machine Learning Model
💡Credit Risk Analysis
💡Data Transformation
💡C Bond Library
💡Pandas DataFrame
💡Bar Plot
Highlights
Understanding normal distribution is crucial before discussing log normal distribution.
A histogram of people's highest database forms a bell curve, which is indicative of normal distribution.
Examples of normal distribution in real life include test scores and employee performance.
People's income database in the US is typically right skewed with most people earning around $50,000.
The income curve is different from a normal distribution because it has an endless tail on the higher end.
Applying a log function to the x-axis of the income distribution results in a normal distribution.
A log normal distribution occurs when applying a log function to a dataset results in a normal distribution.
Hospitalization days and advertising budgets are other examples of log normal distributions.
Log normal distribution is used in data science for building machine learning models, such as predicting loan approvals.
Applying a log transform to income can improve the accuracy of machine learning models by normalizing the data scale.
The log transform technique is especially useful when dealing with data that has a log normal distribution.
The speaker demonstrates the log normal distribution using the C bond library in Python with a U.S. income dataset.
The bar plot created with the C bond library shows a log normally distributed graph, which looks like a bell curve when log is applied to the x scale.
The video provides a link to the code used for demonstrating the log normal distribution in the video description.
Log normal distribution is a common concept in everyday life and is essential when solving data science problems.
If a machine learning model's accuracy is affected by a log normal distribution, applying a log transform can be the solution.
Transcripts
Browse More Related Video

Normal Distribution and Z Score | Math, Statistics for data science, machine learning

What is Skewness? | Statistics | Don't Memorise

Elementary Statistics - Chapter 6 Normal Probability Distributions Part 1
The Normal Distribution, Clearly Explained!!!

Statistics Lecture 3.2: Finding the Center of a Data Set. Mean, Median, Mode

Elementary Stats Lesson #11
5.0 / 5 (0 votes)
Thanks for rating: