Normal Distribution and Z Score | Math, Statistics for data science, machine learning
TLDRThis video delves into the concept of the normal distribution, also known as the Gaussian distribution, and its significance in data science and machine learning. It explains the use of histograms to visualize data distribution and introduces the bell curve as a representation of this distribution. The video also covers the concept of z-score and demonstrates its application in identifying and removing outliers from datasets, which is crucial for accurate data analysis and model building. The content is enriched with practical examples and Python coding snippets, illustrating the process of data cleaning and preparation for machine learning tasks.
Takeaways
- 📊 The normal distribution, also known as Gaussian distribution, is a common pattern in data where most values are near the mean and fewer are further away.
- 📈 A histogram is a visual representation of the distribution of data, showing the frequency of different values.
- 🔔 The bell curve is a graphical representation of a normal distribution, where data points are symmetrically distributed around the mean.
- 👕 Data analysis on attributes like human height can help businesses, such as clothing stores, determine the sizes of products to stock.
- 🏠 Real-world data often follows a normal distribution, such as property prices or test scores, with most values centered around the average.
- 🧐 Outliers are data points that significantly differ from the average and can skew machine learning models if not addressed.
- 🤖 Data scientists use standard deviation to identify and treat outliers, often by removing them or applying transformations.
- 📊 The empirical rule states that in a normal distribution, about 68% of data falls within one standard deviation of the mean, 95% within two, and 99.7% within three.
- 👨💻 Python coding can be used to calculate and apply statistical concepts like standard deviation and z-scores for data analysis and outlier detection.
- 📝 Z-score represents the number of standard deviations a data point is from the mean, and is used to normalize data across different scales.
- 🎯 Practicing with exercises and applying mathematical and statistical concepts in Python is crucial for data science and machine learning.
Q & A
What is the normal distribution or Gaussian distribution?
-The normal distribution, also known as Gaussian distribution, is a probability distribution in which most values lie within a narrow range around the mean, with fewer values occurring as you move further away from the mean. It is characterized by a bell-shaped curve.
What is a histogram in data analysis?
-A histogram is a graphical representation of the distribution of a dataset. It shows the frequency distribution of data by dividing the data into intervals (or bins) and representing each interval with a bar whose height corresponds to the number of observations in that interval.
Why is understanding normal distribution important for data scientists and machine learning engineers?
-Understanding normal distribution is crucial for data scientists and machine learning engineers because many real-world datasets follow this distribution. It aids in data analysis, model building, and prediction. For instance, during data cleaning, normal distribution concepts help in identifying and handling outliers, which can significantly impact the performance of machine learning models.
What is a z-score and how is it calculated?
-A z-score represents the number of standard deviations a data point is from the mean. It is calculated by subtracting the mean from a data point and then dividing the result by the standard deviation. The formula for z-score is: (data point - mean) / standard deviation.
How can you use standard deviation to remove outliers from a dataset?
-Outliers can be removed using standard deviation by identifying data points that fall outside the expected range of values. A common guideline is to consider data points as outliers if they are beyond three standard deviations from the mean, as most of the data (99.7%) falls within this range in a normal distribution.
What is the significance of the 68.3%, 95.5%, and 99.7% values in the context of standard deviation and normal distribution?
-These percentages represent the proportion of data points that fall within specific ranges in a normal distribution. 68.3% of data points fall within plus or minus 1 standard deviation from the mean, 95.5% fall within plus or minus 2 standard deviations, and 99.7% fall within plus or minus 3 standard deviations. These values are crucial for identifying outliers and understanding the spread of the data.
How does the presence of outliers affect data analysis and machine learning processes?
-Outliers can significantly skew the results of data analysis and machine learning processes. They can affect the performance of machine learning models by causing them to overfit to the unusual values, leading to poor generalization and inaccurate predictions on new, unseen data.
What is the general guideline for treating outliers in a dataset?
-The general guideline for treating outliers is to either remove them or apply a transformation to reduce their impact. This can involve using statistical methods based on standard deviation, such as removing data points beyond three standard deviations from the mean, or applying logarithmic transformations to reduce the effect of extreme values.
What is the purpose of the 'c bond' library in Python for plotting the bell curve and histogram?
-The 'c bond' library in Python is used for plotting purposes. It allows for the creation of histograms and the overlay of a bell curve (Kernel Density Estimate or KDE) to better visualize the distribution of the data. The 'hist plot' function within this library is particularly useful for this purpose.
How can you verify if a data point is an outlier based on z-score?
-A data point can be considered an outlier if its z-score is greater than 3 or less than -3. This is because the majority of data points in a normally distributed dataset fall within these z-score ranges, and points outside these thresholds are statistically rare and may indicate outliers.
What is the role of z-score in data cleaning and preparation for machine learning?
-Z-score plays a vital role in data cleaning and preparation for machine learning by helping to identify and treat outliers. By calculating the z-score for each data point, one can determine how many standard deviations each point is from the mean, which aids in deciding whether to remove or transform outliers to improve the quality of the dataset for subsequent analysis or model training.
Outlines
📊 Introduction to Normal Distribution and Z-Score
This paragraph introduces the concept of normal distribution, also known as Gaussian distribution, and the Z-score. It explains their significance in data science and machine learning, particularly in analyzing datasets such as people's height for a clothing store. The paragraph describes how data is often distributed around an average value, with fewer data points at the extremes, forming a bell curve. It sets the stage for understanding how these concepts are used in data analysis and touches on their application in identifying and handling outliers.
📈 Understanding Histograms and Outliers
The second paragraph delves deeper into histograms, which are frequency distributions used to visualize data. It explains how a histogram can reveal outliers—data points that significantly deviate from the average. The paragraph emphasizes the importance of treating outliers in the data science process, as they can skew machine learning models. It introduces the idea of using standard deviation to identify outliers and provides a general guideline for considering data points beyond three standard deviations as outliers.
🔢 Calculating and Applying Standard Deviation
This paragraph focuses on the practical application of standard deviation in identifying outliers. It explains how statisticians use standard deviation to determine the normal range of data points in a distribution. The paragraph provides the empirical rules that 68.3%, 95.5%, and 99.7% of data points fall within one, two, and three standard deviations from the mean, respectively. It then describes how these rules can be applied to remove outliers from a dataset, using a Python coding example to demonstrate the process.
📊 Z-Score Calculation and Outlier Removal
The fourth paragraph introduces the Z-score, which measures the number of standard deviations a data point is from the mean. It explains the concept with the help of a bell curve and provides the formula for calculating Z-scores. The paragraph then illustrates how Z-scores can be used to identify and remove outliers by setting a threshold of three standard deviations. It includes a practical example of applying Z-scores to a dataset in a Jupyter Notebook, showcasing the process of data cleaning and preparing data for further analysis or machine learning modeling.
Mindmap
Keywords
💡Normal Distribution
💡Histogram
💡Bell Curve
💡Z-Score
💡Data Cleaning
💡Outliers
💡Standard Deviation
💡Data Analysis
💡Machine Learning
💡Python Coding
💡Data Scientist
Highlights
The video introduces the concept of normal distribution, also known as Gaussian distribution, and its significance in data science and machine learning.
A practical example is given where a data scientist analyzes people's height data for a clothing store to produce clothes of certain sizes.
Histograms are used to visually represent the frequency distribution of a dataset, such as plotting height samples on a simple chart.
The bell curve is derived from the histogram of a normally distributed dataset, showing most data samples clustered around the average value.
The video explains how normal distribution is observed in various natural datasets, such as prices of apartments or test scores in a classroom.
Outliers are identified as data points that significantly deviate from the average and can be treated using the normal distribution.
The standard deviation is introduced as a measure to help identify outliers, with a rule of thumb that data points beyond three standard deviations can be considered outliers.
Python coding is used to demonstrate how to apply the concepts of normal distribution and standard deviation to remove outliers from a dataset.
The video provides a real-world dataset example, using a height dataset to illustrate the process of outlier removal.
Z-score is introduced as a measure of how many standard deviations a data point is from the mean, which can also be used for outlier detection.
The video demonstrates how to calculate z-scores for each data point in a dataset and use them to identify and remove outliers.
An exercise is provided at the end of the video for viewers to practice the concepts learned and apply them to their own analysis.
The importance of understanding mathematics and statistics for data science and machine learning is emphasized, encouraging viewers to practice and learn in a simple language.
The video series aims to demystify the concepts of math and statistics, showing that they are not as difficult as some may perceive.
The video concludes by encouraging viewers to share the playlist with friends who may find math and statistics challenging, promoting a disciplined approach to learning and practice.
Transcripts
Browse More Related Video
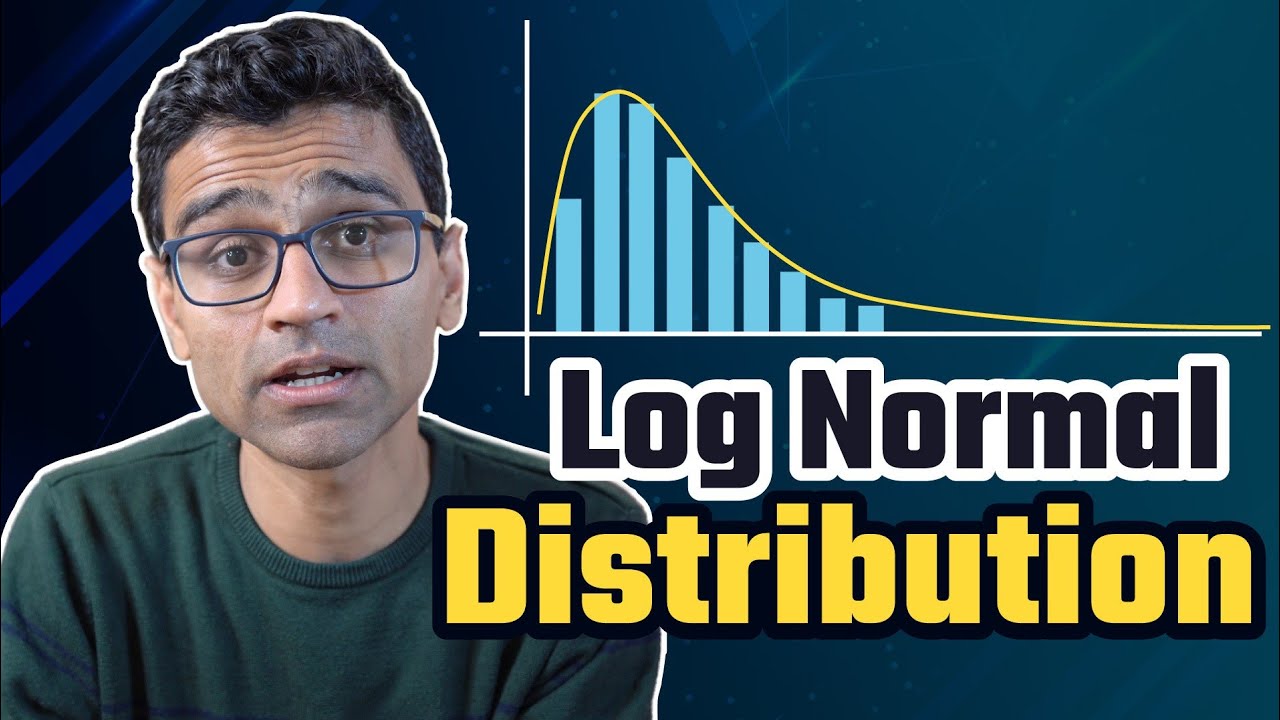
Log normal distribution | Math, Statistics for data science, machine learning

Elementary Statistics - Chapter 6 Normal Probability Distributions Part 1
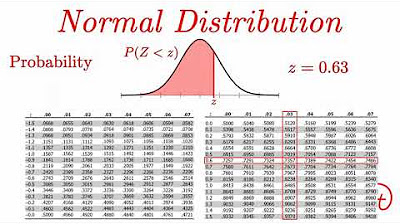
Normal Distribution EXPLAINED with Examples

Elementary Stats Lesson #4

TWITTER SENTIMENT ANALYSIS (NLP) | Machine Learning Projects | GeeksforGeeks
The Normal Distribution, Clearly Explained!!!
5.0 / 5 (0 votes)
Thanks for rating: