The Normal Distribution, Clearly Explained!!!
TLDRThis Stat Quest episode introduces the concept of the normal distribution, also known as the bell curve, emphasizing its importance and prevalence in nature and statistics. The video uses human height as an example to illustrate how the distribution is symmetrical and centered on the mean, with probabilities decreasing as one moves away from the average. It explains that the width of the curve, determined by the standard deviation, indicates the spread of the data, with a wider curve corresponding to a lower probability of extreme values. The episode also touches on the central limit theorem, which is crucial for understanding why the normal distribution is so common in statistical analysis, and promises a future episode dedicated to this theorem.
Takeaways
- 📚 The video is part of a series on the normal distribution, a fundamental concept in statistics.
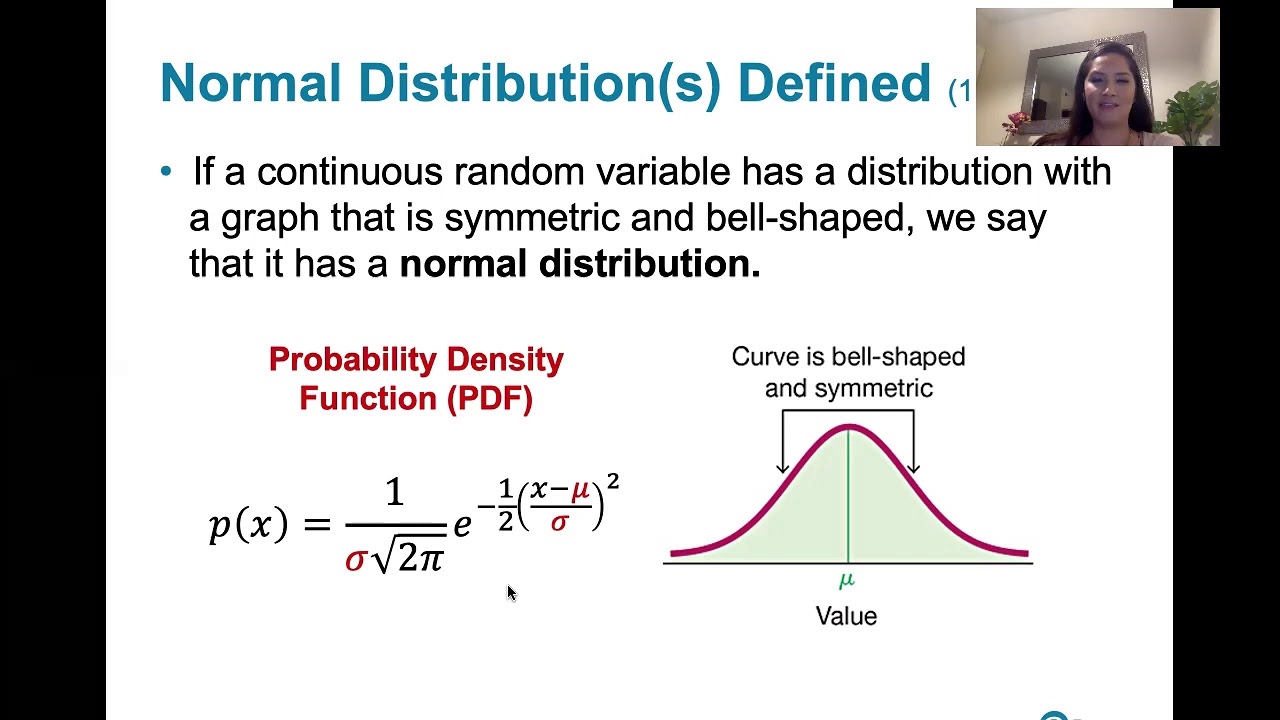
- 📈 The normal distribution is also known as the Gaussian distribution or bell-shaped curve due to its symmetrical shape.
- 🧍 The example used in the video is human height measurements, illustrating the distribution of short, average, and tall individuals.
- 📊 The y-axis in a normal distribution graph represents the relative probability of observing a certain height.
- 📉 It's rare to see extremely short or tall individuals, which is why the curve is lower at the extremes and higher in the middle.
- 👶 Two normal distributions are presented: one for the height of male babies at birth and another for adult males.
- 🔢 The average height for babies is 20 inches, and for adults, it's 70 inches, with both distributions centered on their respective averages.
- 📏 The width of the curve is determined by the standard deviation, with babies having a smaller standard deviation than adults.
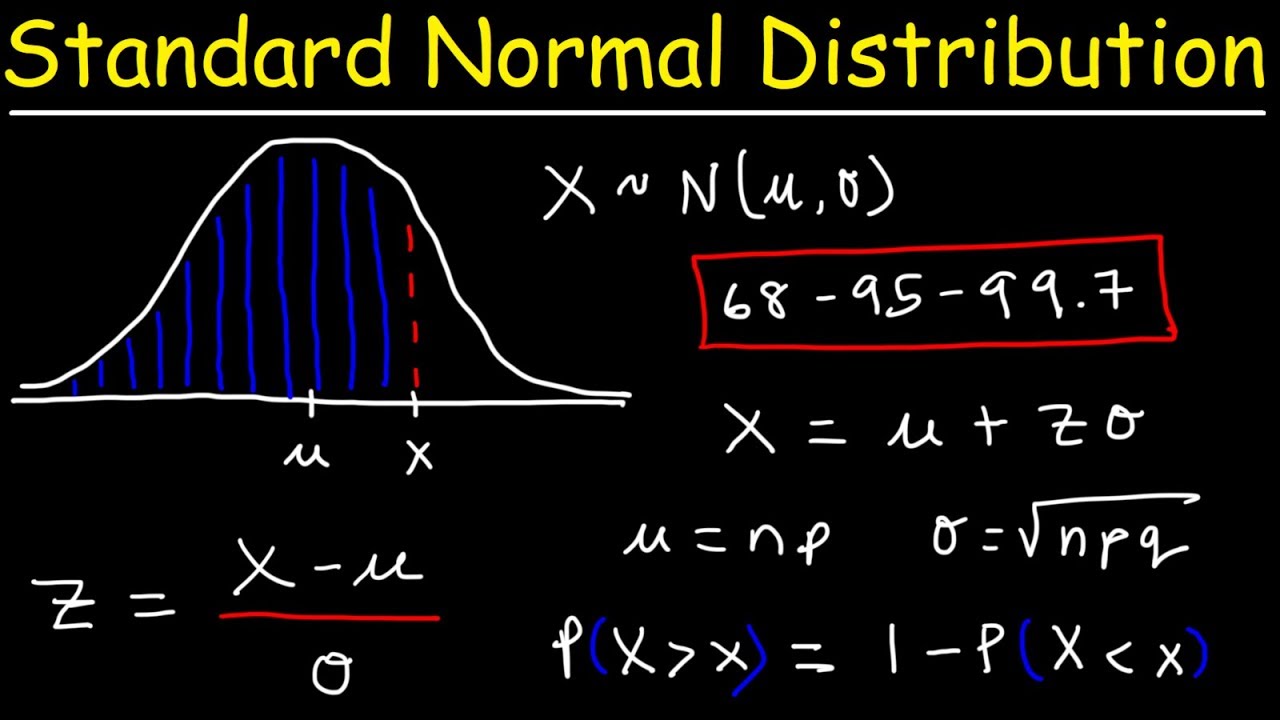
- 🤔 Knowing the standard deviation is crucial as it helps understand that 95% of measurements fall within plus or minus two standard deviations from the mean.
- 👦 For babies, 95% of measurements fall between 20 inches plus or minus 1.2 inches, while for adults, it's between 70 inches plus or minus 8 inches.
- 🌐 Many natural phenomena follow a normal distribution, including height, weight, and commuting times.
- 📘 The video mentions the central limit theorem, which explains the prevalence of the normal distribution in nature and its importance in statistics.
Q & A
What is the normal distribution also known as?
-The normal distribution is also known as a Gaussian distribution or a bell-shaped curve.
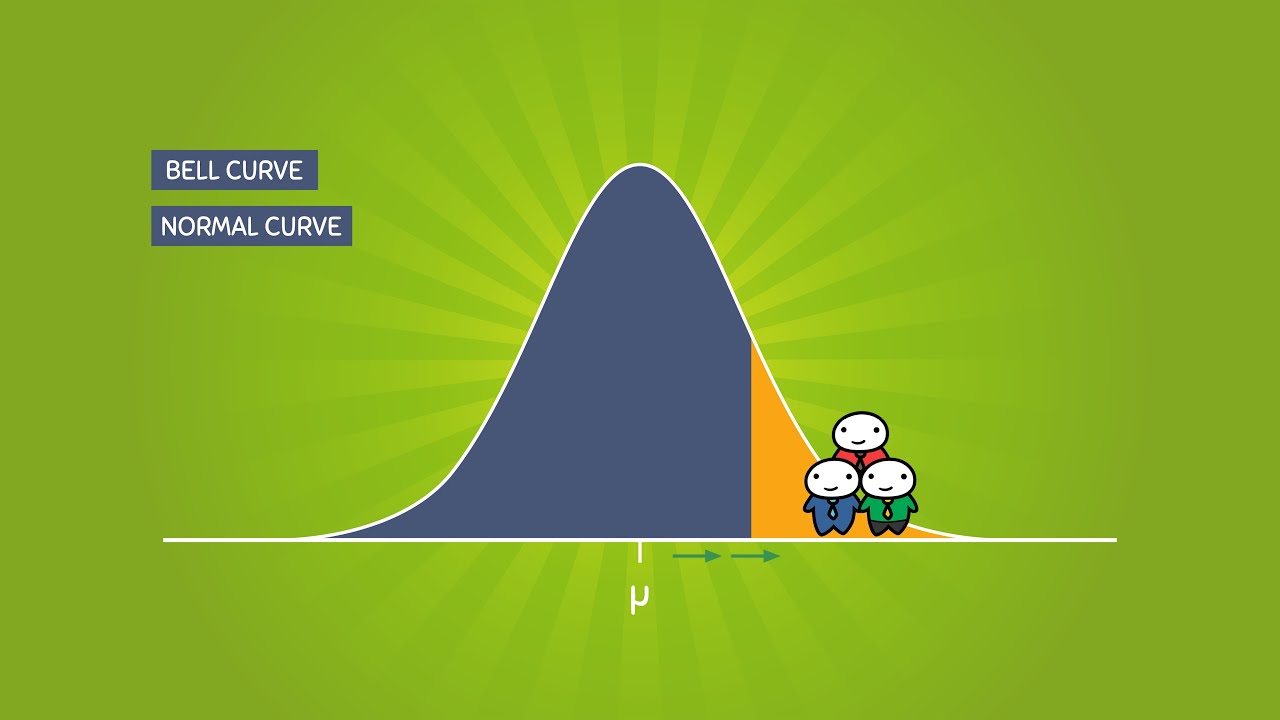
Why is the normal distribution called a bell-shaped curve?
-It is called a bell-shaped curve because it is a symmetrical curve that resembles the shape of a bell.
What does the y-axis represent in a normal distribution graph?
-The y-axis represents the relative probability of observing someone who is really short, really tall, or who has an average height.
What is the average height of a newborn baby in inches according to the script?
-The average height of a newborn baby is 20 inches.
What is the average height of an adult in inches according to the script?
-The average height of an adult is 70 inches.
Why is the curve for babies taller compared to the curve for adults in the normal distribution graph?
-The curve for babies is taller because there are fewer possibilities for adult height compared to babies, making specific measurements less likely.
What is the standard deviation for babies in the normal distribution of height?
-The standard deviation for babies is 0.6.
What is the standard deviation for adults in the normal distribution of height?
-The standard deviation for adults is 4.
What percentage of measurements fall within plus or minus two standard deviations around the mean in a normal distribution?
-95% of the measurements fall within plus or minus two standard deviations around the mean.
What are the two key pieces of information needed to draw a normal distribution?
-To draw a normal distribution, you need to know the average measurement and the standard deviation of the measurements.
Why is the normal distribution important in statistics?
-The normal distribution is important in statistics because it is commonly observed in nature and is very useful due to the central limit theorem, which will be explained in a future Stack Quest.
Outlines
📊 Introduction to Normal Distribution
This paragraph introduces the concept of the normal distribution, also known as the Gaussian distribution or bell curve. It explains that the curve is symmetrical and represents the relative probability of observing someone with a height that is short, average, or tall. The y-axis reflects the likelihood of such observations. The video uses human height measurements as an example, noting that it's rare to see extremely short or tall individuals, hence the curve dips in those areas. Conversely, it's common to observe average heights, making the curve peak in the middle. The script also compares the normal distributions of male human heights at birth and as adults, highlighting how the average and standard deviation change with age. The width of the curve, determined by the standard deviation, is crucial as it shows that 95% of measurements fall within two standard deviations from the mean. The paragraph concludes by mentioning that many natural phenomena follow a normal distribution, hinting at the central limit theorem, a statistical principle that will be explored in a future video.
📝 Engaging the Audience for Future Topics
The second paragraph serves as a call to action for the viewers, encouraging them to subscribe for more content and to leave comments with suggestions for future Stat Quest videos. It maintains viewer engagement by asking for their input on what statistical topics they would like to see covered next. This paragraph is a standard practice in vlogging and educational content to build a community and cater to the audience's interests directly.
Mindmap
Keywords
💡Normal Distribution
💡Bell-Shaped Curve
💡Y-axis
💡Average Height
💡Standard Deviation
💡Probability
💡Measurement
💡Central Limit Theorem
💡Symmetrical Curve
💡Relative Frequency
💡Stack Quest
Highlights
Introduction to the concept of the normal distribution, also known as the Gaussian distribution or bell-shaped curve.
Explanation of the normal distribution's symmetry and its representation of human height measurements.
Description of the y-axis as representing the relative probability of observing different heights.
Illustration of the rarity of observing extremely short or tall individuals, reflected in the curve's height.
Comparison of normal distributions for the height of male humans when born and as adults.
Mention of the average baby height being 20 inches and the average adult height being 70 inches.
Observation that normal distributions are centered on the average value.
Discussion on the probability of a newborn baby's height being between 19 and 21 inches.
Explanation of the wider range of adult height possibilities compared to babies.
Introduction of the concept of standard deviation as a measure of the curve's width.
Comparison of the standard deviation for babies (0.6) and adults (4).
Statistical significance of 95% of measurements falling within plus or minus two standard deviations of the mean.
Practical application of normal distribution in determining the probability of measuring specific heights.
Highlight of the central limit theorem as a reason for the prevalence of normal distribution in nature and its importance in statistics.
Announcement of a future Stack Quest episode dedicated to the central limit theorem.
Encouragement for viewers to subscribe for more educational content.
Invitation for viewers to suggest topics for future Stack Quest episodes in the comments section.
Transcripts
Browse More Related Video

Introduction to the normal distribution | Probability and Statistics | Khan Academy

Elementary Statistics - Chapter 6 Normal Probability Distributions Part 1
6.1.3 The Standard Normal Distribution - Normal Dist. and Properties of the Standard Normal Dist.
Standard Normal Distribution Tables, Z Scores, Probability & Empirical Rule - Stats
6.1.0 The Standard Normal Distribution - Lesson Overview, Learning Outcomes
The Normal Distribution and the 68-95-99.7 Rule (5.2)
5.0 / 5 (0 votes)
Thanks for rating: