How to Use SPSS: Transforming Skewed Data Sets
TLDRThis instructional video teaches viewers how to address skewed data for parametric testing. It explains the concept of skewness, demonstrates how to identify it using descriptive statistics and histograms, and outlines the process of log transformation for normalizing data. The video covers positive and negative skews, including methods to adjust data with zeros or negative values, and reflects data for negative skews before transformation. It concludes by showing how transformed data meets the assumption of normality, enabling the use of parametric statistical tests.
Takeaways
- 📊 The video discusses the issue of skewed data and its incompatibility with parametric testing, which assumes normally distributed data.
- 🛠️ It introduces log transformation as a method to normalize skewed data, making it suitable for parametric statistical analysis.
- ➡️ Two types of log transformations are addressed: for positive and negative skewed data.
- 📈 The process of identifying skewness in a dataset, such as 'days absent,' is demonstrated using descriptive statistics and histograms.
- ⚠️ A positive skew is indicated by a skewness score greater than +1, and a negative skew by a score less than -1.
- 📝 For positive skewed data, a log base 10 transformation is recommended, provided there are no zero or negative values.
- 🔢 The video shows how to perform a log transformation in SPSS, including creating a new variable and using arithmetic functions.
- 📉 For datasets with zero or negative values, a 'mini' transformation is suggested before applying the log transformation.
- 🔄 Reflecting the data is a technique used for negative skewed data, where data points are subtracted from the maximum value plus one.
- 📊 After transformation, the skewness score should ideally be close to zero, indicating a more normal distribution.
- 📚 The transformed data can then be used in parametric tests such as t-tests or ANOVAs, assuming the normality condition is met.
Q & A
What is the main issue with skewed data in the context of parametric testing?
-Skewed data violates one of the major assumptions of parametric testing, which is that the outcome variable should be normally distributed.
What are the two types of log transformations discussed in the script, and how do they differ?
-The two types of log transformations are log base 10 and log natural. Log base 10 is commonly used for data measuring numeric values like days absent or body fat percentage, while log natural is typically used for data expressed in percentages or changes in performance.
How can you determine if a dataset has a positive skew?
-A dataset has a positive skew if the skewness score is greater than one or if it exceeds double the standard error of the skewness score. A positive skew is also visually identified by a histogram with a majority of scores on the left side and a long tail on the right.
What assumptions must be met before performing a log transformation on a dataset?
-The dataset should have a positive skew, and there should be no negative values or zeros in the data distribution.
How can you transform data with zeros or negative values to meet the assumptions for log transformation?
-You can add a constant to all scores in the distribution to ensure that the lowest score is at least one, effectively removing zeros or negative values from the dataset.
What is the process for transforming data with a negative skew to meet the assumptions for parametric testing?
-For data with a negative skew, you first reflect the data by subtracting each score from the highest score plus one, and then perform a log transformation on the reflected data.
How can you visualize the skewness of a dataset?
-You can visualize the skewness of a dataset using a histogram, which will show the distribution of the data and any tails on either end indicating skewness.
What is the significance of the skewness score in determining the normality of a distribution?
-A skewness score close to zero indicates a more normal distribution. A score greater than one or less than negative one suggests a significant skew, indicating a non-normal distribution.
How can you correct an overcorrected skew after performing a log transformation?
-The script does not provide a specific method for correcting an overcorrected skew, but it is mentioned that a slight overcorrection is not unusual. Further statistical analysis or transformation techniques may be required depending on the context.
What are the benefits of transforming skewed data to a more normal distribution?
-Transforming skewed data to a more normal distribution allows for the use of parametric statistical tests, which assume normality. This makes it possible to perform analyses that would otherwise be inappropriate with skewed data.
Can you provide an example of a situation where log transformation might not be suitable?
-Log transformation might not be suitable when dealing with data that includes zero or negative values, as the logarithm of such values is undefined. In such cases, a reflection or other transformation techniques may be necessary before applying a log transformation.
Outlines
📊 Addressing Positive Skewness in Data for Parametric Testing
This paragraph discusses the issue of positive skewness in data, which violates the normality assumption required for parametric testing. The speaker introduces the concept of log transformation as a method to normalize skewed data, specifically focusing on positive skewed data represented by 'days absent' from work or school. The process involves exploring the data for skewness using descriptive statistics and histograms, and then applying a log base 10 transformation after ensuring there are no zero or negative values in the dataset. The goal is to achieve a skewness score closer to zero, thus approximating a normal distribution and enabling the use of parametric statistical tests.
🔢 Transforming Data with Zeros or Negatives Using Logarithms
The speaker explains how to handle datasets with zeros or negative values before applying a log transformation. By adding a constant to all scores to ensure the minimum value is at least one, the data can be adjusted to meet the prerequisites for a log transformation. This 'mini transformation' is demonstrated with an example where 'days absent' scores are modified to fit the criteria, allowing for a subsequent log transformation to correct the skewness and achieve a more normal distribution.
🔄 Correcting Negative Skewness with Data Reflection and Log Transformation
The paragraph addresses the challenge of negative skewness in a dataset, exemplified by 'speed' in miles per hour. The speaker outlines the process of reflecting the data by subtracting each speed score from a value higher than the maximum score in the dataset, effectively moving the data to the left to create a more normal distribution. Following this reflection, a log base 10 transformation is applied to further normalize the data. The effectiveness of this approach is confirmed by a reduced skewness score and a more symmetrical histogram.
📈 Summarizing Techniques for Normalizing Skewed Data
In the concluding paragraph, the speaker summarizes the techniques for normalizing both positively and negatively skewed data. For positive skewness, a simple log base 10 transformation is applied after ensuring no zeros or negative values are present. For negative skewness, the data is first reflected and then subjected to a log base 10 transformation. The speaker emphasizes that these transformations allow the data to meet the normality assumption required for parametric statistical tests, thus expanding the analytical options available for the dataset.
Mindmap
Keywords
💡Skewed Data
💡Parametric Testing
💡Log Transformation
💡Positive Skew
💡Descriptive Statistics
💡Histogram
💡Skewness Score
💡Normal Distribution
💡Reflection
💡Data Transformation
💡Negative Skew
Highlights
The video demonstrates how to transform skewed data for parametric testing.
Skewed data violates the assumption of normal distribution required for parametric tests.
Log transformation is introduced as a method to normalize skewed data.
Two types of log transformations are discussed: for positive and negative skew.
The 'days absent' data set is used as an example of positive skewed data.
Exploration of data skewness through descriptive statistics and histogram visualization.
A skewness score greater than one indicates non-normal distribution.
Log transformation assumptions include the absence of negative values or zeros.
Demonstration of creating a new variable for log base 10 transformation in SPSS.
Correcting positive skew by transforming data to a more normal distribution.
Overcorrection of skew is common and results in a slightly negative skew.
Transformation makes data suitable for parametric tests like t-tests and ANOVA.
Handling data with zeros by adding a constant before log transformation.
Reflecting negatively skewed data before applying log transformation.
The 'speed' data set is used to illustrate negative skew and its transformation.
Reflection involves subtracting each data point from the maximum value plus one.
Post-transformation checks confirm the correction of skewness towards normality.
Final review summarizes the process of transforming both positively and negatively skewed data.
Transcripts
Browse More Related Video

Descriptive Statistics in SPSS

Elementary Stats Lesson #3 A
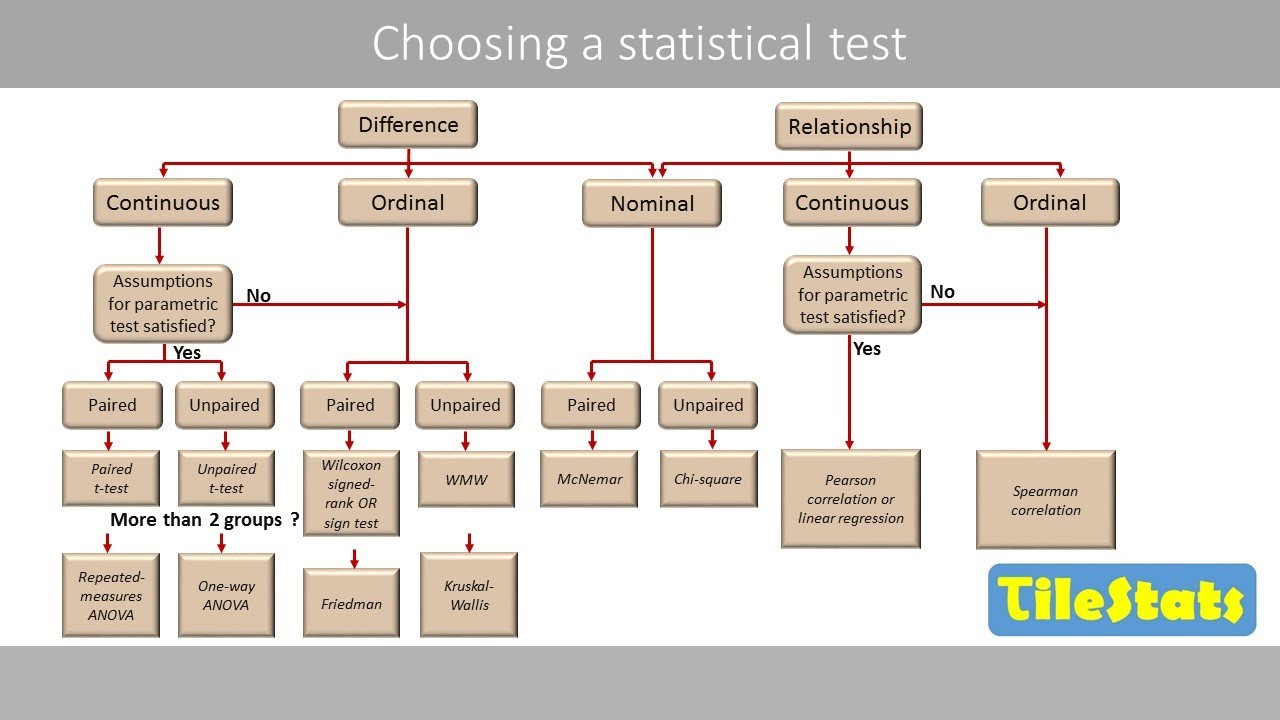
How to choose an appropriate statistical test

Log normal distribution | Math, Statistics for data science, machine learning

Introduction to Descriptive Statistics

Data Analysis Using Excel Analysis ToolPak - Statistical tools and Methods in Practical Research
5.0 / 5 (0 votes)
Thanks for rating: