Graphing Functions and Their Derivatives
TLDRThe script discusses using derivatives to graph functions and get information about them. It explains how the first derivative indicates if a function is increasing or decreasing, while the second derivative shows concavity. An example plots local extrema and inflection points of a cubic polynomial using its derivatives, then sketches the function. Concepts are tied to physics of projectile motion. The goal is developing intuition for relating graphs of functions and their derivatives in order to graph and analyze functions more easily.
Takeaways
- 😀 The derivative of a function at a point equals the rate of change of the function at that point.
- 😯 We can sketch derivatives of functions using our understanding of rates of change, without doing algebra.
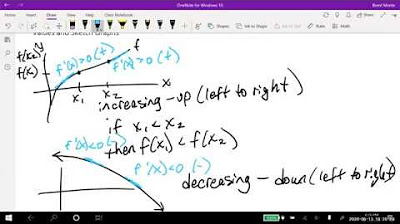
- 📈 The sign of the first derivative tells us if a function is increasing or decreasing.
- 😮 Zeroes of the first derivative indicate maxima and minima of the original function.
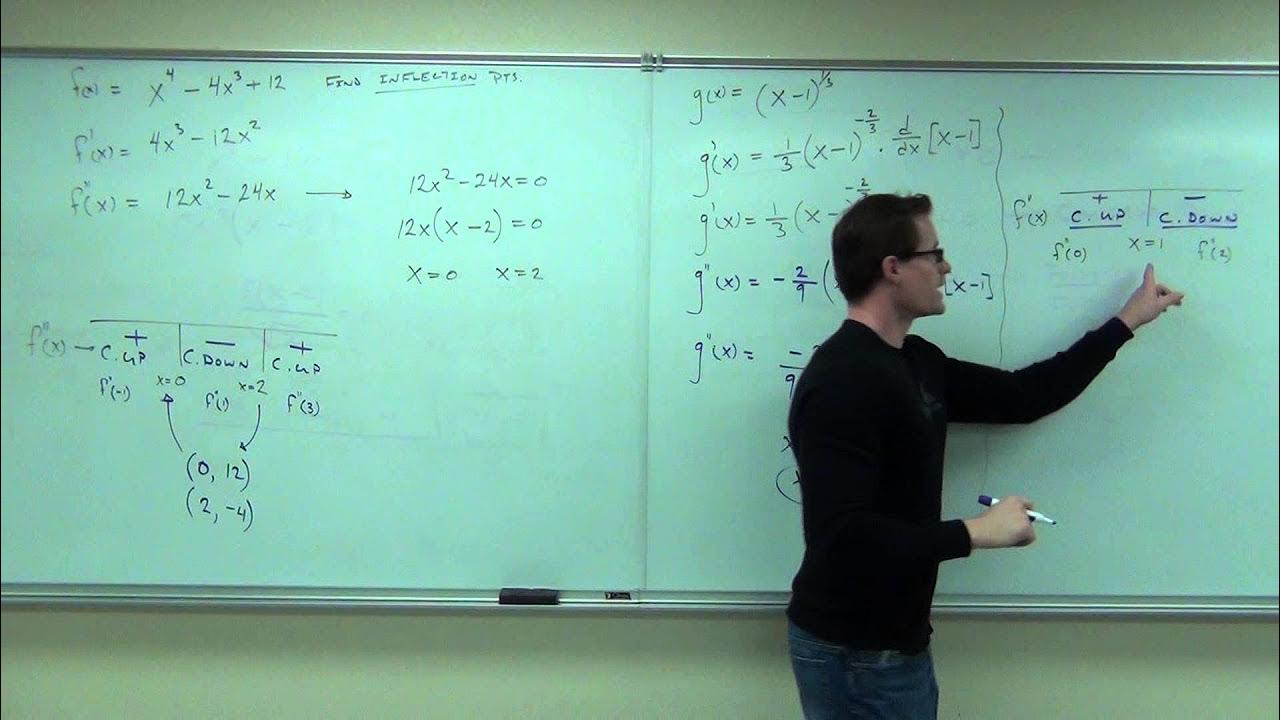
- 📉 Zeroes of the second derivative indicate inflection points where concavity changes.
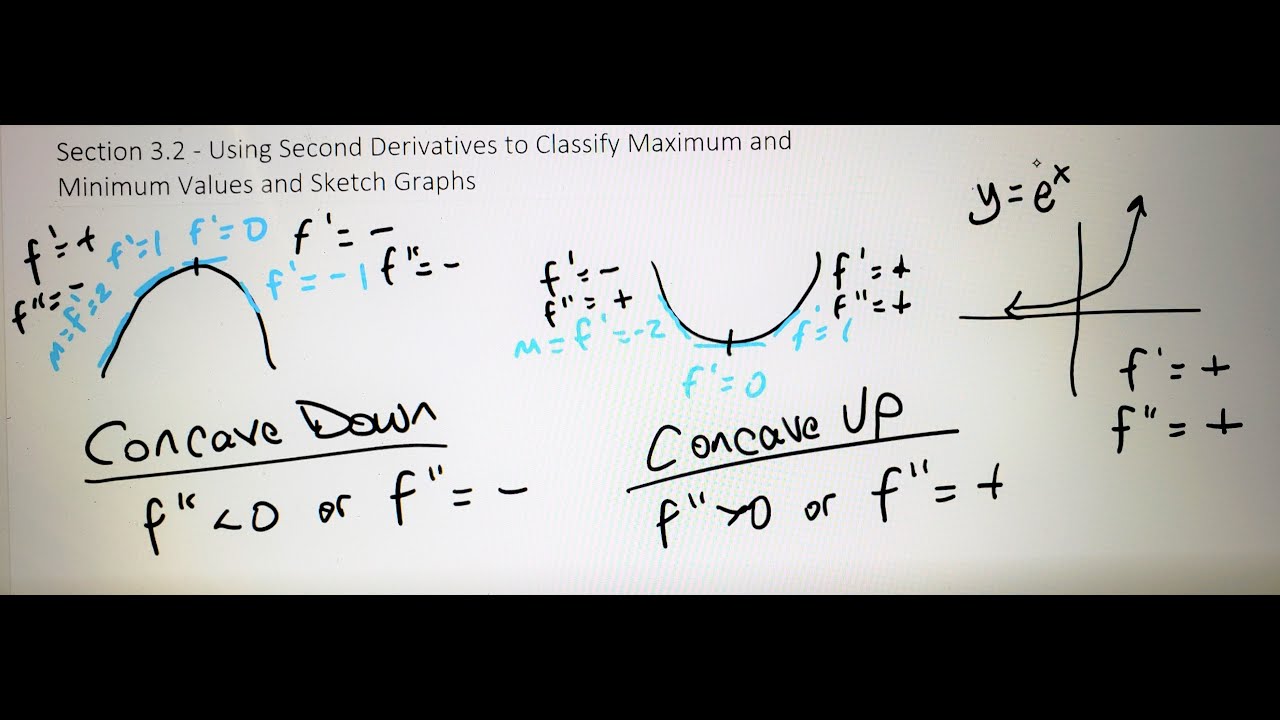
- 👍 Positive second derivative means the function is concave up.
- 👎 Negative second derivative means the function is concave down.
- 🤓 We can use first and second derivatives to accurately sketch polynomials.
- 😃 The motion of a tossed ball illustrates relationships between position, velocity and acceleration graphs.
- 🧠 Understanding derivatives enhances our ability to analyze and graph functions.
Q & A
What is the derivative of a function at a particular point equal to?
-The rate of change in the function at that point.
How can understanding derivatives help us graph functions?
-It helps relate the graph of a function to the graph of its derivative. We can use information about the positive/negative values and zero crossings of the derivative to understand things like where the original function has local maxima/minima and inflection points.
Why is the value of a function unrelated to the rate of change of that function?
-The value refers to the output of the function at a point, while the rate of change refers to how rapidly the output is changing. Shifting a function vertically does not change its rate of change.
How does the graph of position, velocity and acceleration for a ball tossed upwards relate to derivatives?
-Position correlates with the original function, velocity is its first derivative, and acceleration is its second derivative. This shows how higher derivatives relate to the rate of change of lower derivatives.
What do intervals on the second derivative tell us about the original function?
-Positive second derivative values indicate upward concavity of the original function. Negative values indicate downward concavity. Zero crossings indicate inflection points.
How can we find local maxima and minima of a function using derivatives?
-By finding where the first derivative equals zero. These are points where the tangent line is horizontal.
What information do we need about a function to sketch its graph using derivatives?
-The zeros of the first derivative to find extrema, zeros of the second derivative to find inflection points, end behavior, and potentially zeros of the function itself.
Why is a cubic function an odd function based on its first term being positive?
-A cubic function with a positive leading coefficient will be positive for large positive x and negative for large negative x. This makes it an odd function, symmetric about the origin.
What changes in going from a function to its first and second derivatives?
-The degree reduces by 1 each time we take a derivative. So a cubic function becomes quadratic, then linear, then constant for the second derivative.
When sketching a function using derivatives, why don't we find its zeros?
-Finding the zeros can provide more precise graphing information, but the question says to skip this step for now since it involves older algebraic material.
Outlines
📚 Understanding Derivatives to Sketch Graphs
This paragraph explains how the derivative of a function at a point gives the rate of change, and how this concept along with concavity can be used to sketch graphs of functions and their derivatives just by reasoning about their behavior.
🏀 Relating to Projectile Motion
This paragraph provides an example relating the graphs of a quadratic function, its first derivative, and its second derivative to the position, velocity, and acceleration graphs of a ball tossed vertically, illustrating how derivatives relate rates of change.
💡 Putting it All Together
This paragraph works through finding critical points, inflection points, and end behavior of a cubic polynomial, and uses all this information along with reasoning about derivatives to accurately sketch the graph.
Mindmap
Keywords
💡Differentiation
💡Rate of change
💡Concavity
💡Inflection point
💡Local extrema
💡End behavior
💡Tangent line
💡Polynomials
💡Motion
💡Curve sketching
Highlights
The derivative of a function at a point is equal to the rate of change of the function at that point
The value of a function and the rate of change of that function are totally unrelated
The shape of the curve, not vertical shifts, determines the derivative
Graphs of derivatives illustrate motion concepts like position, velocity and acceleration
If the derivative is positive, the function is increasing; if negative, decreasing
Zeros of the derivative indicate maxima and minima of the original function
Inflection points occur where the second derivative is zero
Positive second derivative regions are concave up; negative regions are concave down
Find local extrema by finding zeros of the first derivative
Inflection points occur where the second derivative is zero
Use first and second derivative information to accurately graph polynomials
Cubic functions with positive leading terms rise from negative infinity to positive infinity
Passing through inflection points changes concavity of function graphs
Local extrema represent points where graphs change direction
Derivatives reveal graph details beyond typical algebraic graphing methods
Transcripts
Browse More Related Video

3.2 - Using Second Derivatives to Classify Max and Min Values
Calculus 1 Lecture 3.4: The Second Derivative Test for Concavity of Functions
Math 11 - Section 3.2
Concavity introduction | Using derivatives to analyze functions | AP Calculus AB | Khan Academy
Math 11 - Section 3.1

Business Calculus - Math 1329 - Section 3.2 - Concavity and Points of Inflection
5.0 / 5 (0 votes)
Thanks for rating: