Introduction to Descriptive Statistics
TLDRThis video script provides an essential introduction to descriptive statistics, emphasizing its importance before conducting inferential statistics. It explains the distinction between descriptive and inferential statistics, highlighting the need for data cleaning and ensuring assumptions are met. The script covers key descriptive statistics concepts such as central tendency (mean, median, mode), variability (range, variance, standard deviation), and distribution shape (skewness, kurtosis). It also discusses the significance of normal distribution, the use of frequency distributions, and the interpretation of box plots and histograms to understand data characteristics. The importance of correctly interpreting these statistics for robust data analysis is underscored.
Takeaways
- 📊 Running descriptive statistics is crucial before conducting inferential statistics to ensure data meets the necessary assumptions for robust statistical tests.
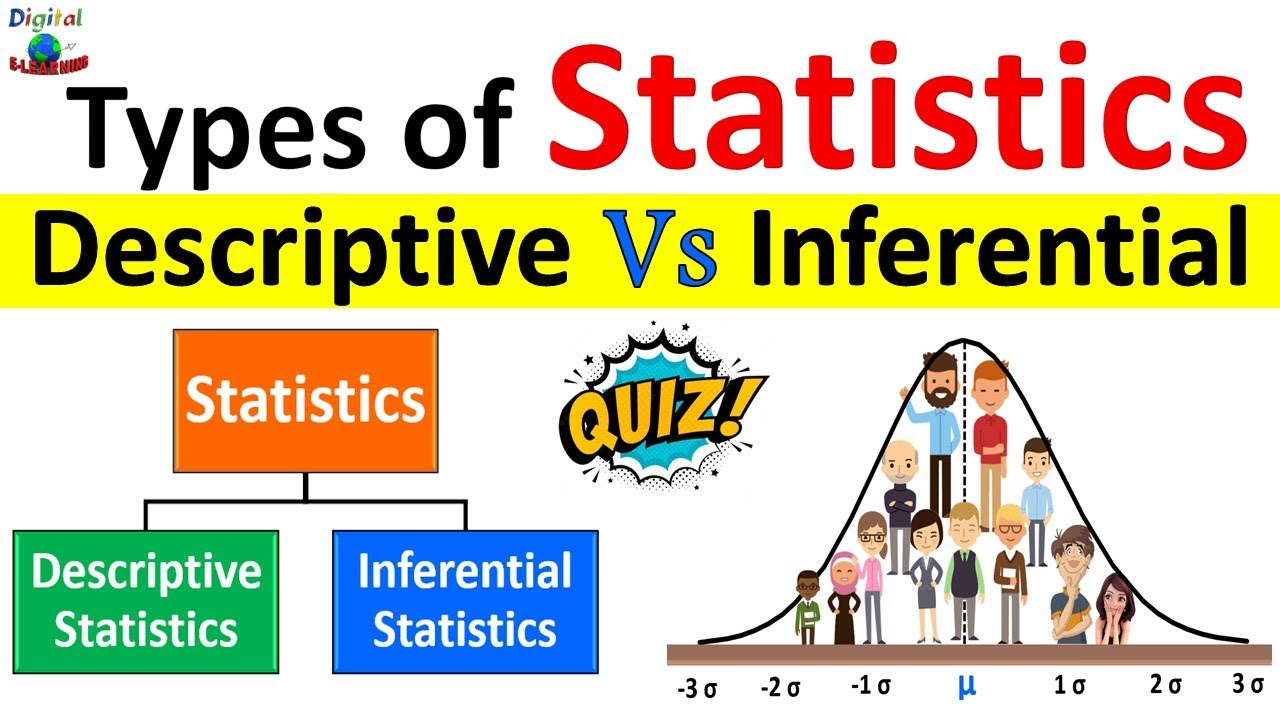
- 🔍 Descriptive statistics organize, summarize, and present data, while inferential statistics use tests to draw conclusions about a sample that can be generalized to a larger population.
- 📈 Descriptive statistics include measures of central tendency (mean, median, mode) and variability (range, variance, standard deviation) to characterize the sample data.
- 📚 Descriptive statistics are essential for understanding the distribution, skewness, and presence of outliers in the data, which are critical for choosing the right statistical tests.
- 📉 The mean is the average and a measure of central tendency, but it can be skewed by outliers, making the median a better choice for data with extreme values.
- 🎯 The median is the middle value in a dataset and is less sensitive to outliers, making it suitable for interval, ratio, and ordinal level data.
- 🔑 The mode is the most frequently occurring value and is the only measure of central tendency applicable to nominal data like gender or race.
- 📋 Frequency distributions and visual representations, such as histograms, help in identifying the mode and understanding the distribution of data.
- 📏 The range, variance, and standard deviation are measures of dispersion that provide insights into the spread of data and its deviation from the mean.
- 📊 The normal distribution, or bell curve, is a key concept in statistics, with properties that most statistical tests assume, such as the distribution of values around the mean.
- 📉 Skewness and kurtosis are measures that describe the shape of the data distribution, with implications for the choice of statistical tests and the interpretation of results.
Q & A
Why is running descriptive statistics on a dataset crucial before conducting inferential statistics?
-Running descriptive statistics is crucial as it helps in organizing, summarizing, and understanding the characteristics of the data. It ensures that the data is clean, meets the necessary assumptions for robust statistical tests, and is representative of the population before drawing any conclusions through inferential statistics.
What are the two broad categories within the field of statistics?
-The two broad categories within the field of statistics are descriptive and inferential. Descriptive statistics involve presenting, organizing, and summarizing data, while inferential statistics involve running tests and drawing conclusions about a sample that can be generalized to a larger population.
What is the purpose of descriptive statistics in relation to a sample?
-Descriptive statistics are used to describe the characteristics of a sample, determine if it has a normal distribution, and check if it can be compared to a larger population. It helps in summarizing, describing, and characterizing the sample data through measures such as mean, median, mode, range, variance, and standard deviation.
What are the three measures of central tendency in statistics?
-The three measures of central tendency in statistics are the mean (average), the median (midpoint of the data), and the mode (the most frequently occurring number).
Why might the mean not be the best measure of central tendency in a sample with outliers?
-The mean might not be the best measure of central tendency in a sample with outliers because outliers can significantly skew the average, making it less representative of the overall data. In such cases, the median, which is not sensitive to outliers, provides a more accurate central value.
What is the difference between the range and standard deviation as measures of variability?
-The range is the simplest measure of variability, calculated as the difference between the maximum and minimum values in a dataset. It is sensitive to extreme values and sample size. The standard deviation, on the other hand, represents the average distance of scores from the mean and is less sensitive to extreme values, providing a more robust measure of dispersion.
How is the standard deviation calculated and why is it important in understanding data distribution?
-The standard deviation is calculated by taking the square root of the variance, which is the average of the squared differences from the mean. It is important because it quantifies the amount of variation in the data, helping to understand the spread and dispersion of the data points around the mean.
What does the bell curve represent and why is it significant in statistics?
-The bell curve represents a normal distribution of data. It is significant because it shows that approximately 68% of the values fall within one standard deviation of the mean, 95% within two standard deviations, and 99% within three standard deviations. This understanding is crucial for making inferences about a population based on a sample.
What is the purpose of a box plot and how does it help in data analysis?
-A box plot is a graphical representation of the distribution of data based on the five-number summary: minimum, first quartile (Q1), median, third quartile (Q3), and maximum. It helps in visualizing the spread, skewness, and potential outliers in the data, providing a quick overview of the data's distribution and central tendencies.
What is skewness and how can it be calculated or interpreted?
-Skewness is a measure of the asymmetry of the probability distribution of a real-valued random variable. It can be calculated by subtracting the median from the mean and dividing by the standard deviation. Interpretation involves comparing the mean, median, and mode; if the mean is greater than the median and mode, the data is positively skewed, and if the mean is less, it is negatively skewed. A skewness greater than ±0.5 is considered moderately skewed, and greater than ±1 is extremely skewed.
What is kurtosis and how does it relate to the shape of a data distribution?
-Kurtosis is a measure that describes the 'tailedness' of the probability distribution. It provides an estimate of whether the data are peaked or flat relative to a normal distribution. A kurtosis value of zero indicates a mesokurtic distribution similar to a normal distribution. A kurtosis greater than zero suggests a leptokurtic distribution, which is sharper with thicker tails, indicating a higher probability for extreme values. A negative kurtosis indicates a platykurtic distribution, which is flatter with a wider peak and less probability for extreme values.
Outlines
📊 Introduction to Descriptive and Inferential Statistics
This paragraph introduces the concept of descriptive statistics, emphasizing its importance before conducting inferential statistics. It explains that novice researchers often overlook the necessity of cleaning and verifying data against assumptions required for robust statistical tests. Descriptive statistics involve organizing, summarizing, and presenting data, whereas inferential statistics extend conclusions from a sample to a larger population. The paragraph outlines the importance of determining if the sample has a normal distribution, which is a prerequisite for many statistical tests. It also introduces key descriptive statistics such as mean, median, mode, range, variance, standard deviation, and skewness, explaining their relevance in understanding the characteristics of a sample.
📈 Descriptive Statistics: Measures of Central Tendency and Variability
The second paragraph delves deeper into the measures of central tendency, including the mean, median, and mode, and explains their applicability based on the data's characteristics and distribution. It discusses the implications of outliers on the mean and when the median might be a more appropriate measure. The mode's role in representing the most frequent value and its suitability for nominal data is highlighted. The paragraph also covers measures of variability such as range, standard deviation, and variance, describing how they provide insights into the spread and distribution of data. Additionally, it introduces the concepts of frequency distributions, quartiles, and box plots as tools for visualizing and understanding data dispersion and central tendencies.
📉 Understanding Data Distribution: Skewness and Kurtosis
The third paragraph focuses on the concepts of skewness and kurtosis, which are essential for understanding the shape and distribution of data. It explains how to interpret positive and negative skewness by comparing the mean, median, and mode, and how to quantify skewness through calculation. The paragraph also discusses the implications of high skewness values on the choice of statistical tests. Kurtosis is introduced as a measure of whether the data distribution is peaked or flat compared to a normal distribution, with examples of leptokurtic, platykurtic, and mesokurtic distributions. The importance of recognizing and accounting for skewness and kurtosis in statistical analysis is emphasized, as these characteristics can significantly affect the interpretation of data and the selection of appropriate statistical tests.
Mindmap
Keywords
💡Descriptive Statistics
💡Inferential Statistics
💡Data Assumptions
💡Central Tendency
💡Variability
💡Normal Distribution
💡Outliers
💡Skewness
💡Kurtosis
💡Frequency Distribution
💡Box Plot
Highlights
Descriptive statistics are crucial before conducting inferential statistics.
Running descriptive statistics helps to screen and clean data for robust statistical tests.
Descriptive statistics involve presenting, organizing, and summarizing data.
Inferential statistics involve drawing conclusions about a population from sample results.
Descriptive statistics describe sample characteristics and infer them to the larger population.
Normal distribution is a requirement for most statistical tests.
Descriptive statistics are displayed as tables, charts, percentages, and frequency distributions.
Measures of central tendency include the mean, median, and mode.
The mean is the sum of all values divided by the number of values.
The median is the midpoint of ordered values, not sensitive to outliers.
The mode is the most frequently occurring value, appropriate for nominal variables.
Range, variance, and standard deviation measure the variability in a sample.
Skewness and kurtosis describe the shape of the data distribution.
Interquartile range is the distance between the first and third quartiles, not sensitive to extremes.
Box plots visually represent data distribution and can show outliers.
Highly skewed data cannot use robust statistical tests and require weaker tests.
Skewness and kurtosis are calculated to understand the distribution shape and are important for statistical analysis.
Transcripts
Browse More Related Video

Descriptive Statistics: FULL Tutorial - Mean, Median, Mode, Variance & SD (With Examples)

Descriptive Statistics [Simply explained]
Descriptive Statistics vs Inferential Statistics | Measure of Central Tendency | Types of Statistics

Elementary Stats Lesson #3 A

What is Descriptive Statistics? A Beginner's Guide to Descriptive Statistics!

Tutorial 1- What Is Statistics And What Are Its Types In Hindi?
5.0 / 5 (0 votes)
Thanks for rating: