6.3.3 Sampling Distributions and Estimators - Sampling Distribution of the Sample Means
TLDRThis video explores the concept of the sampling distribution of sample means, illustrating how it relates to the population mean. It explains that the sample mean, denoted as x-bar, serves as an unbiased estimator of the population mean, with its distribution tending toward normality as sample size increases. The script uses examples to demonstrate the calculation of the sampling distribution and shows empirically that the mean of sample means equals the population mean, reinforcing the reliability of using sample means to estimate population parameters.
Takeaways
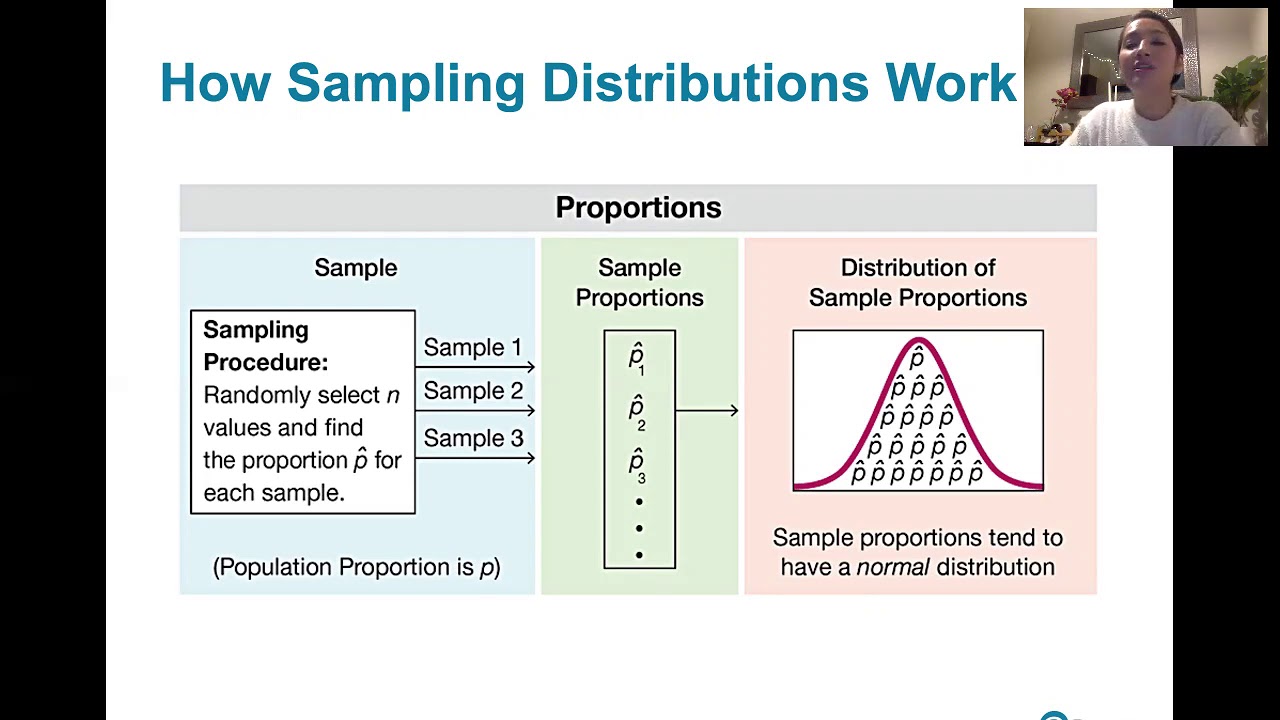
- 📚 The sampling distribution of sample means is the distribution of all possible sample means taken from the same population with a fixed sample size.
- 🔍 The sample mean (x̄) is used as an estimator for the population mean (μ) and is considered an unbiased estimator since its expected value equals the population mean.
- 📉 As the sample size (n) increases, the distribution of sample means tends to become more normal, which is further discussed in the context of the Central Limit Theorem.
- 📈 The mean of the sample means is equal to the population mean, which is a key property of an unbiased estimator.
- 🌰 An example is provided using a small population with three elements (4, 17, 11) to illustrate the calculation of the population mean and the sampling distribution of sample means.
- 🎲 Another example involves rolling a die five times to simulate the process of generating sample means and observing the distribution's convergence to normality with a large number of trials.
- 📊 The script explains that the mean of sample means from a large number of trials (e.g., 10,000) approximates the true population mean, demonstrating the effectiveness of sample means as estimators.
- 📉 The distribution of sample means from repeated trials is approximately normal, especially when the number of trials is large, which aligns with the theoretical expectations.
- 🔢 The population mean in the die-rolling example is calculated to be 3.5, and the mean of the sample means from 10,000 trials also equals 3.5, confirming the unbiased nature of the sample mean as an estimator.
- 🔑 The script emphasizes that using sample means to estimate the population mean is a reliable approach due to their unbiasedness and the distribution's tendency to normalize with larger sample sizes.
Q & A
What is the sampling distribution of sample means?
-The sampling distribution of sample means is the distribution of all possible values of the sample mean when all possible samples of the same size n are taken from the same population.
What does it mean for a sample mean to be an unbiased estimator of the population mean?
-A sample mean is an unbiased estimator of the population mean if the mean of the distribution of sample means is equal to the population mean, meaning the expected value of the sample mean is the population mean.
How does the distribution of sample means relate to the normal distribution?
-The distribution of sample means tends to be a normal distribution, and it becomes closer to a normal distribution as the sample size n increases, which is further discussed in the context of the central limit theorem.
What is the notation used for the sample mean?
-The sample mean is denoted as \( \bar{x} \) and is pronounced 'x bar'.
Can you explain the process of finding the population mean from a given set of numbers?
-To find the population mean, you sum all the numbers in the set and then divide by the total count of numbers. For example, for the numbers 4, 17, and 11, you would calculate \( (4 + 17 + 11) / 3 \).
What is the significance of the multiplication counting rule in determining the number of possible samples?
-The multiplication counting rule is used to determine the total number of possible samples when selecting with replacement from a population. It multiplies the number of options for each selection to find the total combinations, such as 3 options for the first selection and 3 for the second, resulting in 3 * 3 = 9 possible samples.
How can you find the sample mean for each possible sample?
-To find the sample mean for each possible sample, you sum the values of the sample and then divide by the number of values in the sample. For example, for a sample of [4, 17], the mean would be \( (4 + 17) / 2 \).
What is the purpose of summarizing the sampling distribution of sample means in a probability distribution table?
-The purpose of summarizing the sampling distribution in a probability distribution table is to organize and display the possible sample means, their frequencies, and probabilities, which helps in understanding the distribution's characteristics and in calculating the mean of the sample means.
How does the mean of the sample means compare to the population mean in the context of an unbiased estimator?
-The mean of the sample means is expected to be equal to the population mean, which confirms that the sample mean is an unbiased estimator of the population mean. This relationship is demonstrated through calculations using the probability distribution table.
What is the practical difference between calculating the exact sampling distribution and using a large number of trials to approximate it?
-Calculating the exact sampling distribution involves considering all possible outcomes and their probabilities, which is feasible for small sample spaces but impractical for large ones. Using a large number of trials to approximate the distribution, such as rolling a die 10,000 times, provides an empirical estimate that can be more manageable and still yield a close approximation to the true distribution.
Why is the sample mean considered a good estimator for the population mean?
-The sample mean is considered a good estimator for the population mean because it is an unbiased estimator, meaning that if you take many samples and calculate their means, the average of these sample means will be equal to the population mean over the long run.
What does the central limit theorem imply about the distribution of sample means as the sample size increases?
-The central limit theorem implies that as the sample size increases, the distribution of sample means will approach a normal distribution, regardless of the shape of the population distribution, given a sufficiently large sample size.
Outlines
📚 Introduction to Sampling Distribution of Sample Means
This paragraph introduces the concept of the sampling distribution of sample means, which is the distribution of all possible sample means from a population when samples of the same size are taken. The sample mean (x̄) is an unbiased estimator of the population mean (μ), meaning its expected value equals the population mean. The distribution of sample means tends to be normal and becomes more so as the sample size increases. An example is provided with a small population to illustrate the calculation of the population mean and all possible sample means, emphasizing that the mean of sample means is equal to the population mean.
🔍 Calculating Sample Means and Their Distribution
The paragraph demonstrates the process of calculating sample means from all possible samples of a given size from a small population. It details the steps to find the sample mean for each sample, the creation of a probability distribution table for these sample means, and the verification that the mean of these sample means equals the population mean. The example involves rolling a die five times to select values from a population and finding the mean of results, highlighting the large number of possible samples and the impracticality of listing them all.
🎲 Theoretical vs. Empirical Approach to Sampling Distributions
This section contrasts the theoretical calculation of all possible sample means with the empirical approach of performing many trials to estimate the sampling distribution. It discusses the impracticality of calculating the exact probabilities for a large number of samples, such as rolling a die five times, which results in 7,776 possible outcomes. Instead, the empirical method involves repeating the process many times, such as rolling the die 10,000 times, to observe the distribution of sample means.
📊 Empirical Evidence of Sampling Distribution Normality
The paragraph describes an empirical study where a die is rolled 10,000 times to generate a large sample of means, which are then used to create a frequency distribution. The resulting distribution is approximately normal, with a mean that closely matches the expected population mean of 3.5. This demonstrates the central limit theorem's effect, where the distribution of sample means approaches normality as the number of trials increases, regardless of the population distribution.
🌟 Conclusion on the Unbiased Estimation of Population Mean
The final paragraph concludes the discussion by emphasizing that the mean of sample means is an unbiased estimator of the population mean. It reiterates the empirical findings that the mean of 10,000 sample means equals the population mean of 3.5, validating the effectiveness of using sample means to estimate the population mean. The paragraph also notes the normal distribution's characteristics observed in the empirical data, setting the stage for the next topic: the sampling distribution of sample variance.
Mindmap
Keywords
💡Sampling Distribution of Sample Means
💡Unbiased Estimator
💡Population Mean (μ)
💡Sample Mean (x̄)
💡Central Limit Theorem
💡Normal Distribution
💡Sample Size (n)
💡Probability Distribution Table
💡Expected Value
💡Rolling a Die
Highlights
The sampling distribution of sample means is the distribution of all possible values of the sample mean taken from the same population.
The sample mean (x̄) is an unbiased estimator of the population mean (μ), meaning the mean of the distribution of sample means equals the population mean.
The distribution of sample means tends to be normal and becomes closer to a normal distribution as the sample size (n) increases.
An example demonstrates calculating the sampling distribution of sample means for a small population with three elements.
The population mean is calculated by adding all numbers and dividing by the total count, in this case, 32/3.
All possible samples of size n=2 are listed, resulting in nine possible samples due to the multiplication counting rule.
Sample means are calculated for each of the nine samples, resulting in various values such as 4, 7.5, 10.5, 11, 14, and 17.
A probability distribution table is created to summarize the sampling distribution of the sample means.
The mean of the sample means is shown to be equal to the population mean, demonstrating the unbiased nature of the sample mean as an estimator.
A second example involves rolling a die five times to select values from a population of one to six and finding the mean of the results.
There are 7,776 possible samples when rolling a die five times, illustrating the impracticality of listing all possible outcomes.
The process of rolling the die ten thousand times and computing the sample mean each time results in an approximate normal distribution.
The mean of the sample means from ten thousand trials is found to be exactly 3.5, equal to the population mean.
The central limit theorem will be discussed in the next lesson, further explaining the tendency of the distribution of sample means to become normal.
The video concludes with the affirmation that the mean of sample means will always be equal to the true population mean, emphasizing the reliability of sample means as estimators.
The video also discusses the practical application of this concept in estimating population means through repeated sampling.
The importance of sample size (n) in achieving a normal distribution for the sampling distribution of sample means is reiterated.
Transcripts
Browse More Related Video
6.3.1 Sampling Distributions and Estimators - Sampling Distributions Described and Defined
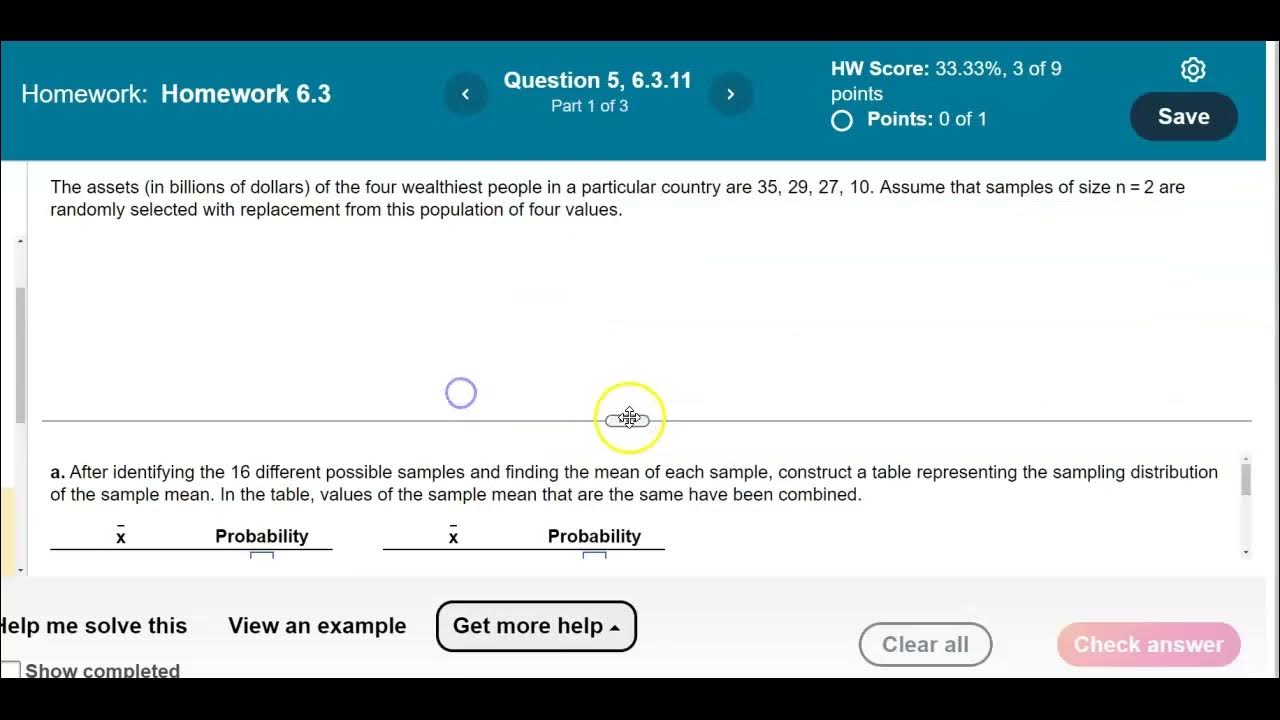
Math 14 HW 6.3.11 Is a sample mean an unbiased estimator of the population mean?
The Sampling Distribution of the Sample Mean

6.3.4 Sampling Distribution and Estimators - Sampling Distribution of Sample Variance

Sampling distribution of the sample mean 2 | Probability and Statistics | Khan Academy
Sampling Distributions: Introduction to the Concept
5.0 / 5 (0 votes)
Thanks for rating: