Math 14 HW 6.3.11 Is a sample mean an unbiased estimator of the population mean?
TLDRThe video script outlines a statistical exercise where the assets of the four wealthiest individuals in a country are used to demonstrate the concept of sampling distribution. It details the process of randomly selecting samples of size two with replacement, calculating the mean of each sample, and constructing a table to represent the sampling distribution of the sample mean. The script guides through the steps of using software to perform these calculations and emphasizes the unbiased nature of the sample mean as an estimator of the population mean, concluding that sample means are indeed good estimators of the population mean.
Takeaways
- 📊 The video discusses a statistical exercise involving the assets of the four wealthiest individuals in a country, with values in billions of dollars: 35, 29, 27, and 10.
- 🔢 The task involves randomly selecting samples of size n=2 with replacement from the given population of four asset values.
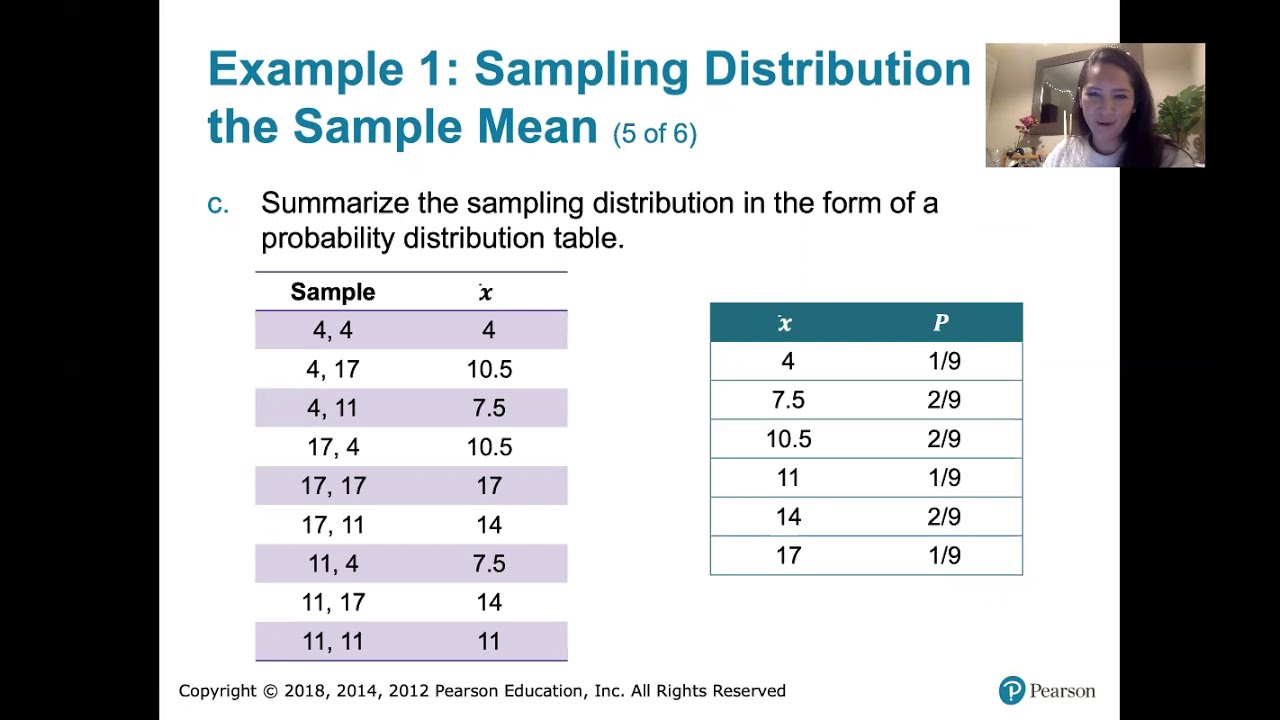
- 🎲 The script describes identifying all 16 possible samples that can be drawn from the population and calculating the mean of each sample.
- 📝 A table is constructed to represent the sampling distribution of the sample mean, where identical sample means are combined.
- 📈 The process of creating the sample data in StatCrunch is detailed, including the replication of combinations for n=2.
- 🧐 The mean of the sample means is calculated and organized in a table, which is then sorted in descending order.
- 📉 The probabilities for each sample mean in the distribution table are determined by their frequency relative to the total number of samples (16).
- 🔍 The video compares the mean of the population to the mean of the sampling distribution of the sample mean, finding them to be equal at 25.25.
- 🤔 The script raises the question of whether sample means are good estimates of the population mean, suggesting that they are because the mean is an unbiased estimator.
- 📚 The exercise demonstrates the Law of Large Numbers and the Central Limit Theorem, showing that as sample size increases, the sampling distribution of the sample mean approaches the population mean.
- 📝 The video provides a step-by-step guide on how to perform this statistical analysis using StatCrunch software.
Q & A
What is the task described in the script?
-The task is to construct a table representing the sampling distribution of the sample mean from a population of four asset values (35, 29, 27, and 10), where samples of size n=2 are randomly selected with replacement.
How many different possible samples are there for the given population?
-There are 16 different possible samples when selecting two assets with replacement from the population.
What is the sample size in the given scenario?
-The sample size (n) is two, as mentioned in the script.
How does the script suggest to find the mean of each sample?
-The script suggests using a statistical software like StatCrunch to calculate the mean of each sample by selecting the rows and using the 'mean' function.
What is the population mean of the given asset values?
-The population mean is calculated to be 25.25, after rounding to two decimal places.
What is the mean of the sample means according to the script?
-The mean of the sample means is also 25.25, which matches the population mean.
Why is the mean considered an unbiased estimator according to the script?
-The mean is considered an unbiased estimator because it targets the population mean, providing a good estimate of the population mean in general.
How does the script handle the combination of identical sample means in the table?
-The script combines identical sample means in the table to simplify the representation of the sampling distribution.
What is the probability associated with each unique sample mean in the table?
-The probability for each unique sample mean is calculated as the number of occurrences of that mean divided by the total number of samples (16), and simplified where possible.
How does the script ensure the data is sorted in descending order for the table?
-The script instructs to sort the data in descending order to organize the table based on the values of the sample means.
What is the significance of comparing the mean of the population to the mean of the sampling distribution of the sample mean?
-The comparison is significant to verify that the sample means are good estimates of the population mean, demonstrating the effectiveness of the mean as an estimator.
Outlines
📊 Constructing the Sampling Distribution of the Sample Mean
The script explains the process of creating a sampling distribution of the sample mean from a population of four asset values representing the wealthiest individuals in a country. It involves identifying all 16 possible samples of size n=2 with replacement and calculating the mean of each. The results are then organized into a table, where identical sample means are combined. The script also demonstrates how to use a statistical software called StatCrunch to create the sample, calculate the means, and organize the data into a table. The probabilities for each sample mean are calculated based on their frequency in the 16 possible samples.
🔍 Comparing Population Mean to Sample Mean Distribution
This paragraph delves into comparing the mean of the entire population to the mean of the sampling distribution of the sample mean. It guides through the calculation of the population mean using the given asset values and the mean of the sample means obtained from the previous analysis. The script uses StatCrunch to perform these calculations and finds that both means are equal, which is rounded to 25.25. The conclusion is that the sample means are good estimators of the population mean, as they are unbiased estimators, indicating that the sample means accurately reflect the central tendency of the population.
Mindmap
Keywords
💡Assets
💡Wealthiest People
💡Sample Size (n)
💡Random Sampling
💡Replacement
💡Sampling Distribution
💡Sample Mean
💡StatCrunch
💡Population Mean
💡Unbiased Estimator
Highlights
The task involves analyzing the assets of the four wealthiest individuals in a country, with values in billions of dollars: 35, 29, 27, and 10.
Samples of size n=2 are randomly selected with replacement from the population of these four values.
The objective is to construct a table representing the sampling distribution of the sample mean.
A total of 16 different possible samples are identified, and the mean of each sample is calculated.
Values of the sample mean that are the same are combined in the table for clarity.
The process of creating the sample data set is demonstrated using StatCrunch software.
The sample data set includes all possible combinations of the four asset values for a sample size of 2.
The mean of the sample means is calculated to understand the central tendency of the sampling distribution.
The calculated means are sorted in descending order for ease of analysis.
Probabilities for each sample mean are determined based on their frequency in the 16 possible samples.
The population mean is calculated to compare with the mean of the sampling distribution.
The mean of the population is found to be 25.25 when rounded to two decimal places.
The mean of the sample means is also calculated to be 25.25, indicating a match with the population mean.
The comparison shows that the mean of the population is equal to the mean of the sample means.
The discussion explores whether sample means are good estimates of the population mean.
It is concluded that sample means are generally good estimates of the population mean due to the mean being an unbiased estimator.
Transcripts
Browse More Related Video
6.3.3 Sampling Distributions and Estimators - Sampling Distribution of the Sample Means
6.3.1 Sampling Distributions and Estimators - Sampling Distributions Described and Defined
SAMPLING DISTRIBUTION OF SAMPLE MEANS - WITH AND WITHOUT REPLACEMENT

6.3.4 Sampling Distribution and Estimators - Sampling Distribution of Sample Variance
6.3.2 Sampling Distributions and Estimators - Sampling Distribution of Sample Proportions
Sampling Distributions: Introduction to the Concept
5.0 / 5 (0 votes)
Thanks for rating: