Sampling distribution of the sample mean 2 | Probability and Statistics | Khan Academy
TLDRThe video script discusses the impact of sample size (n) on the sampling distribution of the sample mean. It explains that as sample size increases, the distribution of sample means approaches a normal distribution, in accordance with the central limit theorem. The script also highlights that a larger sample size results in a smaller standard deviation, leading to a more precise estimate of the population mean. The concept is illustrated through simulations comparing different sample sizes and their resulting distributions.
Takeaways
- 📊 The sampling distribution of the sample mean changes as the sample size (n) varies.
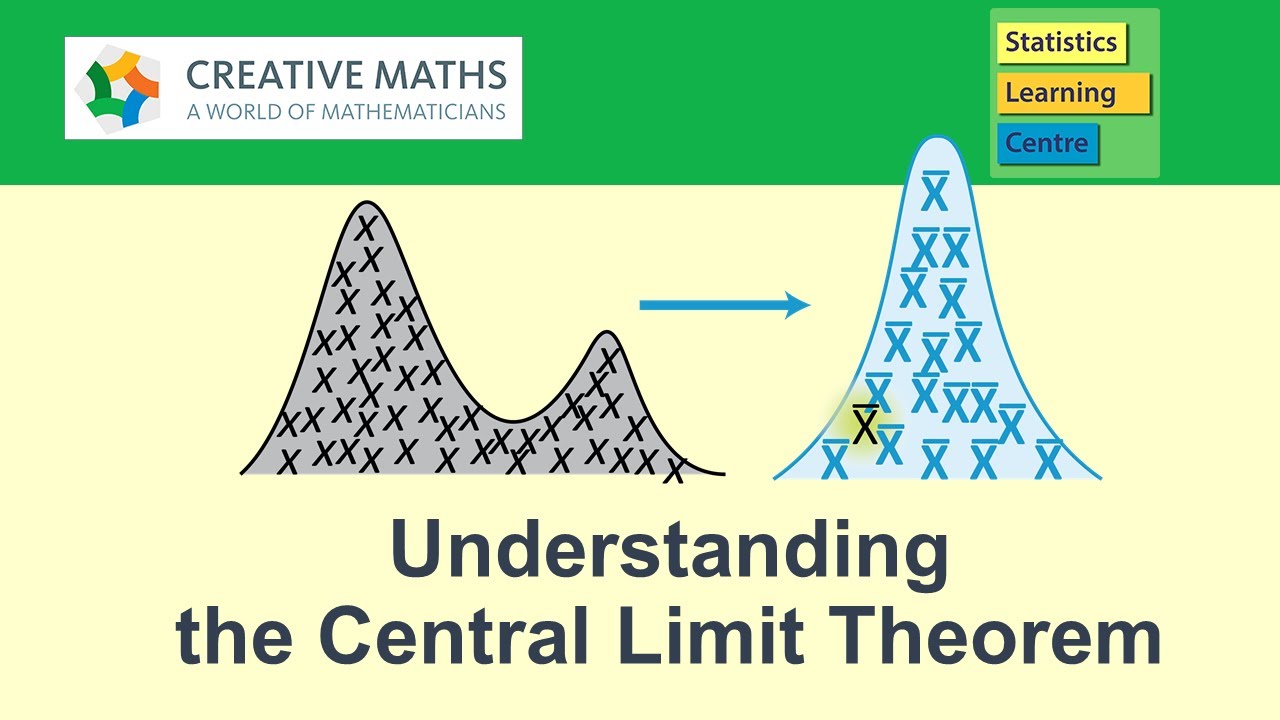
- 🔄 Even with a non-normal distribution, as sample size increases, the distribution of sample means approaches a normal distribution.
- 💡 The Central Limit Theorem states that the sampling distribution of the sample mean approaches a normal distribution as n approaches infinity.
- 🔢 For small values of n (e.g., n=1 or n=2), the sampling distribution does not resemble a normal distribution.
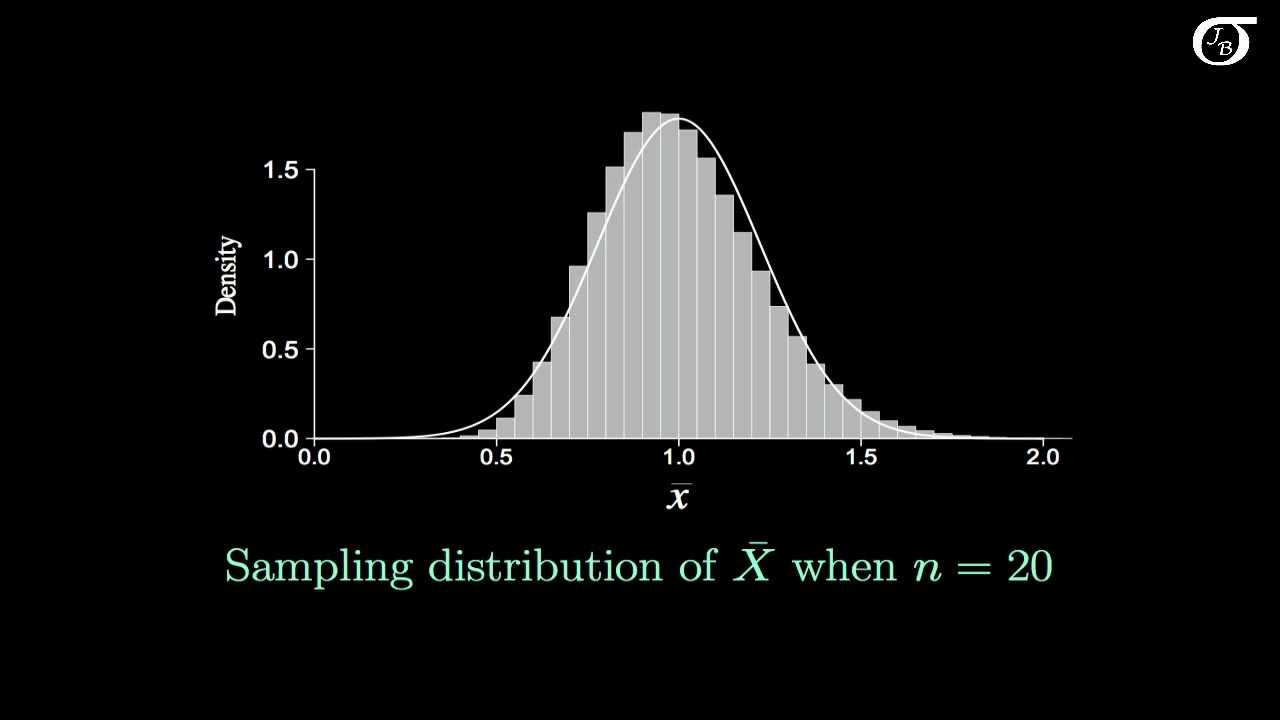
- 📈 With larger sample sizes (e.g., n=10 or n=15), the sampling distribution is very close to a normal distribution.
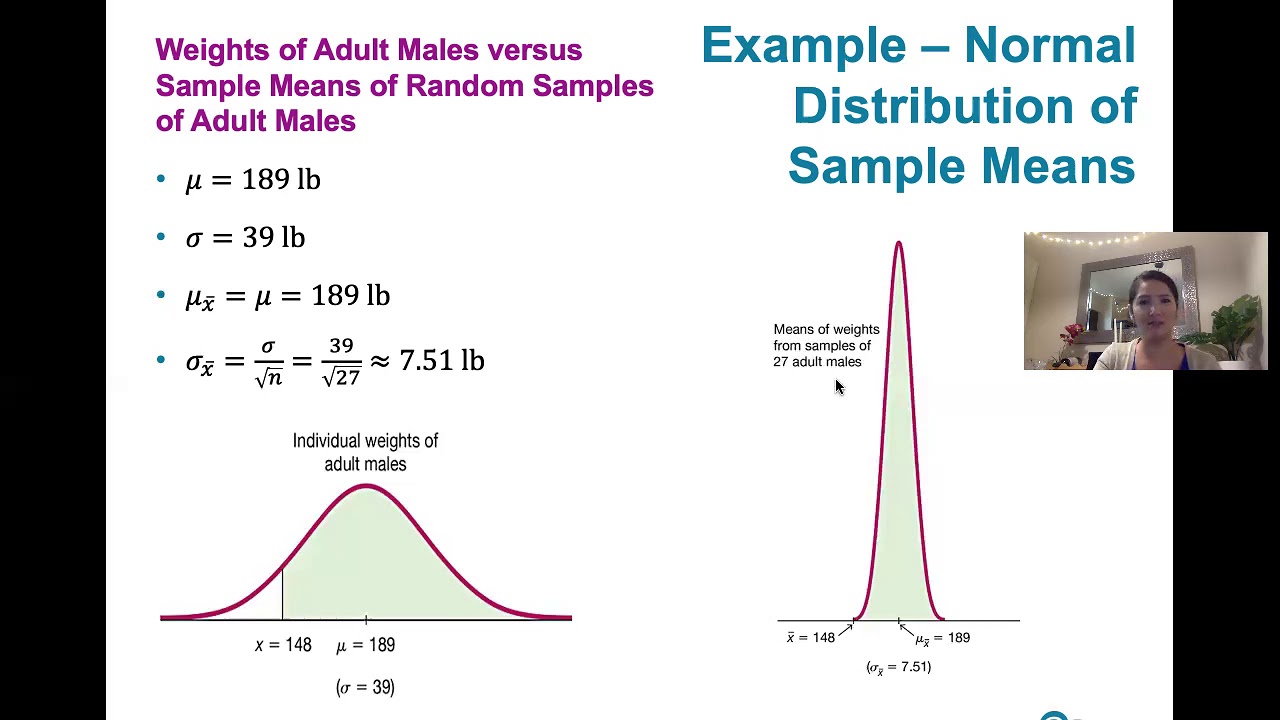
- 🌟 The mean of the sampling distribution of the sample mean is equal to the population mean, regardless of the sample size.
- 📉 As the sample size increases, the standard deviation of the sampling distribution decreases, leading to a more focused distribution around the mean.
- 🔽 The skewness and kurtosis of the sampling distribution decrease with larger sample sizes, making it closer to a normal distribution.
- 🧮 The distribution of sample means becomes a better approximation of the true population distribution as more samples are taken and averaged.
- 🔧 The relationship between the standard deviation of the original distribution and the standard deviation of the sampling distribution of the sample mean can be described by a formula that depends on the sample size.
- 🔄 The process of averaging multiple samples can be visualized and understood through simulations, which demonstrate the effects of varying sample sizes on the distribution shape.
Q & A
What is the central theme of the video?
-The central theme of the video is the exploration of how the sampling distribution of the sample mean changes as the sample size 'n' varies.
How does the distribution of sample means evolve with different sample sizes?
-The distribution of sample means evolves from a shape that can be quite different from a normal distribution to one that increasingly resembles a normal distribution as the sample size 'n' increases.
What happens when the sample size 'n' is equal to 1?
-When the sample size 'n' is equal to 1, the sampling distribution of the sample mean does not resemble a normal distribution, as it is simply the individual values from the original distribution.
How does the central limit theorem relate to the sample size 'n'?
-The central limit theorem states that as the sample size 'n' approaches infinity, the sampling distribution of the sample mean becomes more like a normal distribution.
What is the significance of the standard deviation changing with sample size 'n'?
-The significance is that as the sample size 'n' increases, the standard deviation of the sampling distribution of the sample mean decreases, making the distribution more concentrated around the mean.
What does the video suggest about the relationship between sample size and the accuracy of estimating the mean?
-The video suggests that larger sample sizes lead to more accurate estimates of the mean, as the sampling distribution becomes more concentrated and resembles a normal distribution more closely.
What are the implications of the skew and kurtosis of the sampling distribution?
-The skew and kurtosis of the sampling distribution indicate how much the distribution deviates from a normal shape. As 'n' increases, the skew and kurtosis values become closer to those of a normal distribution, indicating a more symmetric and less peaked distribution.
How does the video illustrate the concept of the central limit theorem?
-The video illustrates the central limit theorem through simulations that show how the sampling distribution of the sample mean evolves from a non-normal shape to a normal distribution as the sample size 'n' increases.
What is the practical implication of the central limit theorem in real-world sampling?
-The practical implication is that in real-world sampling, one can obtain a good approximation of the normal distribution by using a sufficiently large sample size, even if the original distribution is not normal. This allows for the application of statistical methods that assume normality.
What does the video suggest about the number of trials needed to observe the central limit theorem in action?
-The video suggests that while the central limit theorem theoretically applies as 'n' approaches infinity, in practice, a sample size of 10 to 15 is often sufficient to obtain a good approximation of a normal distribution.
How does the video demonstrate the effect of sample size on the variance of the sampling distribution?
-The video demonstrates that as the sample size 'n' increases, the variance of the sampling distribution decreases, leading to a more focused distribution around the mean, which is beneficial for estimating population parameters.
Outlines
📊 Understanding Sampling Distribution of the Sample Mean
This paragraph introduces the concept of the sampling distribution of the sample mean and explores how this distribution changes with varying sample sizes (n). It begins with a review of how any arbitrary distribution can be used to generate random samples, and how averaging these samples can lead to a distribution that increasingly resembles a normal distribution as the sample size increases. The central limit theorem is alluded to, which states that the larger the sample size, the closer the sampling distribution approximates a normal distribution. The paragraph also discusses the limitations of the central limit theorem for very small sample sizes, such as n=1, and how increasing the sample size leads to a more accurate representation of the normal distribution.
🔄 Approaching Normality with Larger Sample Sizes
This paragraph delves deeper into the central limit theorem and its implications for sample sizes. It explains that while a larger sample size (n) does not guarantee a perfect normal distribution, it significantly improves the approximation. The paragraph emphasizes that even moderate sample sizes, such as n=10 or 15, can yield a very close approximation to a normal distribution. It also touches on the importance of conducting many trials to better understand and estimate the true underlying distribution. The concept that as n approaches infinity, the sampling distribution of the sample mean becomes more precise and closely mirrors the normal distribution is also discussed.
📉 The Impact of Sample Size on Standard Deviation
This paragraph discusses the effect of increasing the sample size (n) on the standard deviation of the sampling distribution of the sample mean. It illustrates through simulations and examples that not only does the distribution become more normal with larger sample sizes, but the standard deviation also decreases, indicating a more concentrated distribution around the mean. The paragraph compares the results of simulations with sample sizes of 2, 16, and 25, highlighting how larger sample sizes lead to distributions with lower skew and kurtosis, and tighter standard deviations. It concludes by hinting at a mathematical relationship between the standard deviation of the original distribution and that of the sampling distribution, which will be explored in greater detail in a subsequent video.
Mindmap
Keywords
💡Sampling Distribution
💡Sample Size (n)
💡Normal Distribution
💡Central Limit Theorem
💡Standard Deviation
💡Skewness
💡Kurtosis
💡Simulation
💡Probability Density Function
💡Sample Mean
Highlights
Exploration of how the sampling distribution of the sample mean changes with varying sample size n.
Review of previous content on the sampling distribution of the sample mean.
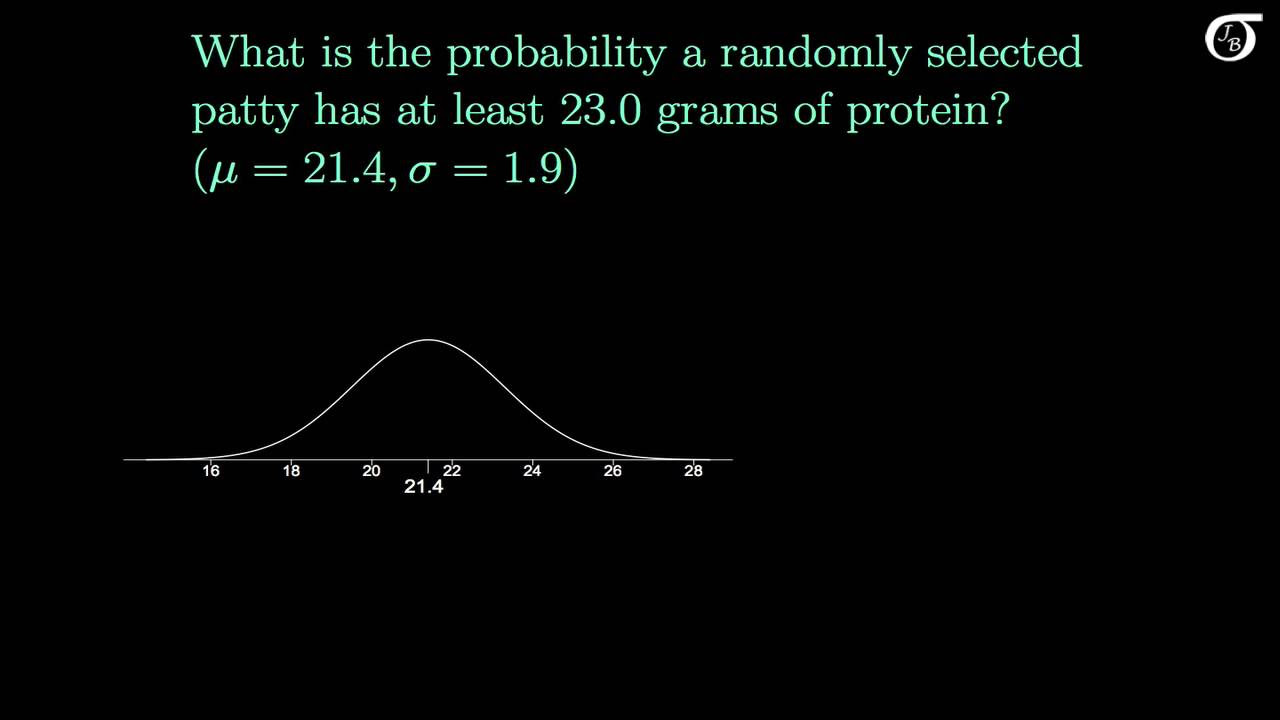
Demonstration of how a non-normal distribution can be approximated by a normal distribution through sampling.
Illustration of sampling from a discrete distribution and the impact on the resulting sample mean distribution.
Explanation of the central limit theorem and its application to the sampling distribution as n approaches infinity.
Discussion on the limitations of the central limit theorem when n equals one.
Insight on how increasing sample size n improves the approximation of a normal distribution.
Observation that a sample size of two still does not result in a normal distribution.
Comparison of the impact of sample sizes on the shape of the sampling distribution.
Demonstration of how the standard deviation of the sampling distribution decreases with larger sample sizes.
Explanation of how the skewness and kurtosis of the sampling distribution change with different sample sizes.
Illustration of the convergence to a normal distribution with increasing sample sizes through simulations.
Discussion on the relationship between the number of samples taken and the precision of the mean estimate.
Introduction to the concept that the standard deviation of the sampling distribution is related to the sample size.
Preview of a future discussion on the formula relating the standard deviation of the original distribution to the standard deviation of the sampling distribution.
Overall, the transcript provides a comprehensive understanding of the effects of sample size on the sampling distribution of the sample mean.
Transcripts
Browse More Related Video
The Sampling Distribution of the Sample Mean
The Central Limit Theorem - understanding what it is and why it works
6.4.1 The Central Limit Theorem - What the Central Limit Theorem Says and What It Doesn't Say
Introduction to the Central Limit Theorem
Central Limit Theorem & Sampling Distribution Concepts | Statistics Tutorial | MarinStatsLectures

Elementary Stats Lesson #13
5.0 / 5 (0 votes)
Thanks for rating: