6.3.4 Sampling Distribution and Estimators - Sampling Distribution of Sample Variance
TLDRThis video script delves into the sampling distribution of sample variance, illustrating its relationship with the population variance. It explains that sample variance is an unbiased estimator of population variance, with a mean equal to the population variance. The script provides an example using a small population to demonstrate the calculation of sample variances and their distribution, highlighting the skewed right distribution's tendency. It also discusses the theoretical approach to calculating probabilities and means of sample variances in a large number of trials, such as rolling a die multiple times, and confirms the unbiased nature of sample variance through empirical results.
Takeaways
- 📚 The script discusses the sampling distribution of sample variance and its relation to the population variance, emphasizing the concept that the sample variance is an unbiased estimator of the population variance.
- 📉 The sampling distribution of sample variance tends to be skewed to the right with a long right tail, indicating that larger variances are less common than smaller ones.
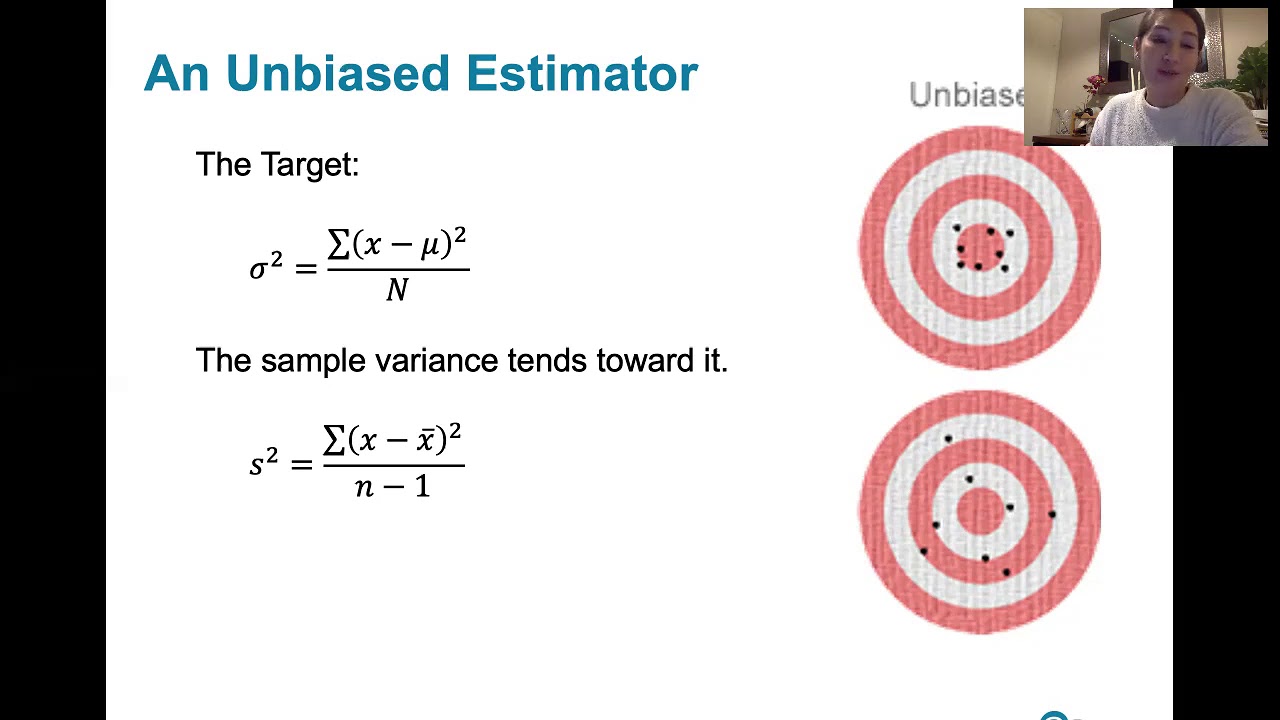
- 🔍 The mean of the distribution of sample variances is always equal to the population variance, which is why the sample variance is considered an unbiased estimator.
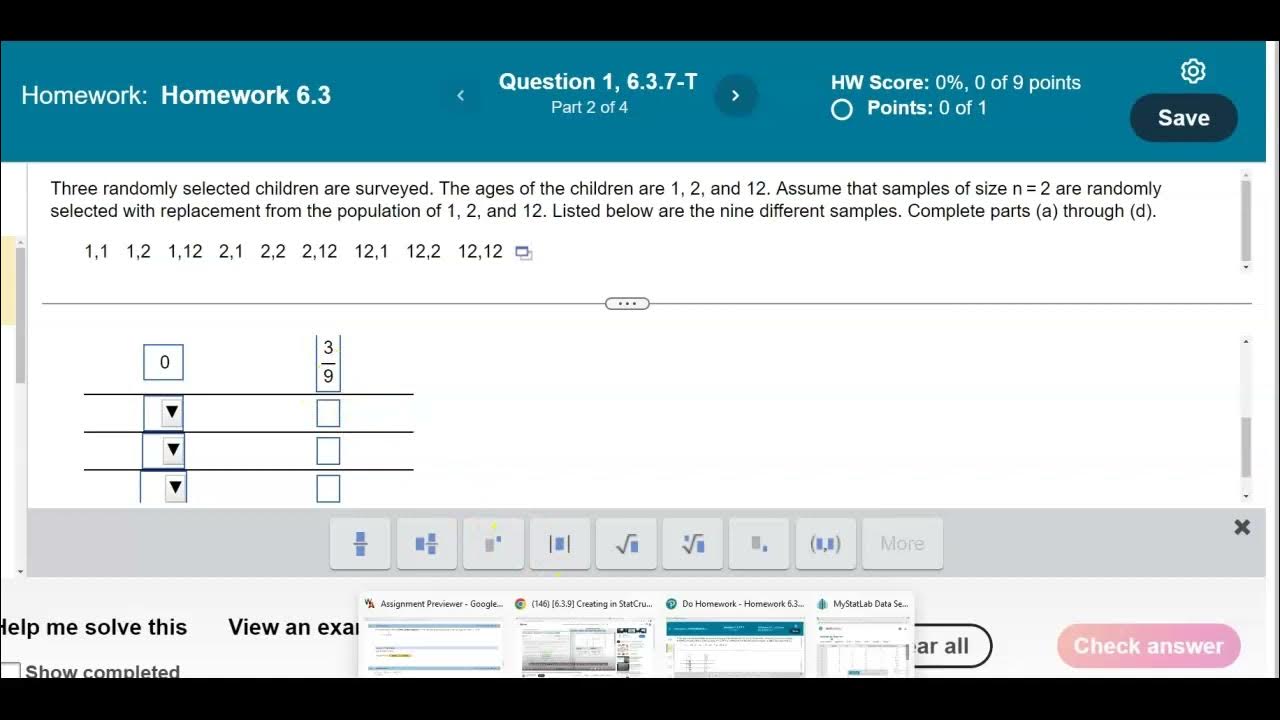
- 📈 The script provides an example of calculating the population variance from a small dataset and demonstrates the process of creating a sampling distribution by finding all possible samples of size n=2 with replacement.
- 📝 The process of calculating sample variances for each possible sample is explained, showing how to compute the mean of these variances and confirming that it equals the population variance.
- 🎯 The example illustrates that even with a small sample size, the mean of the sample variances converges to the population variance, validating the unbiased nature of the sample variance as an estimator.
- 🎲 The script contrasts the theoretical approach of calculating the sampling distribution with an empirical approach, where a die is rolled many times to approximate the distribution of sample variances.
- 📊 The empirical results from rolling a die multiple times show that the mean of the sample variances approximates the population variance, which is consistent with the theoretical expectation.
- 🤔 The script suggests that while it's theoretically possible to calculate the exact probabilities for every possible outcome (like rolling a die), in practice, an empirical approach can provide a good approximation.
- 📉 It is highlighted that the sample variances distribution is not symmetric and does not follow a normal distribution due to its skewness to the right.
- 📚 The overall message is that the sample variance is a reliable and unbiased estimator of the population variance, and the script provides both theoretical and empirical evidence to support this.
Q & A
What is the sampling distribution of sample variance?
-The sampling distribution of sample variance is the distribution of all possible values of sample variance (s^2) when all possible samples of the same size n are taken from the same population.
What is the notation used for sample variance?
-The notation used for sample variance is s^2.
Why is sample variance considered an unbiased estimator of the population variance?
-Sample variance is considered an unbiased estimator of the population variance because the mean of the distribution of sample variances is always equal to the population variance.
What is a characteristic of the distribution of sample variances?
-The distribution of sample variances tends to be skewed to the right, with a long right tail.
How is the population variance calculated?
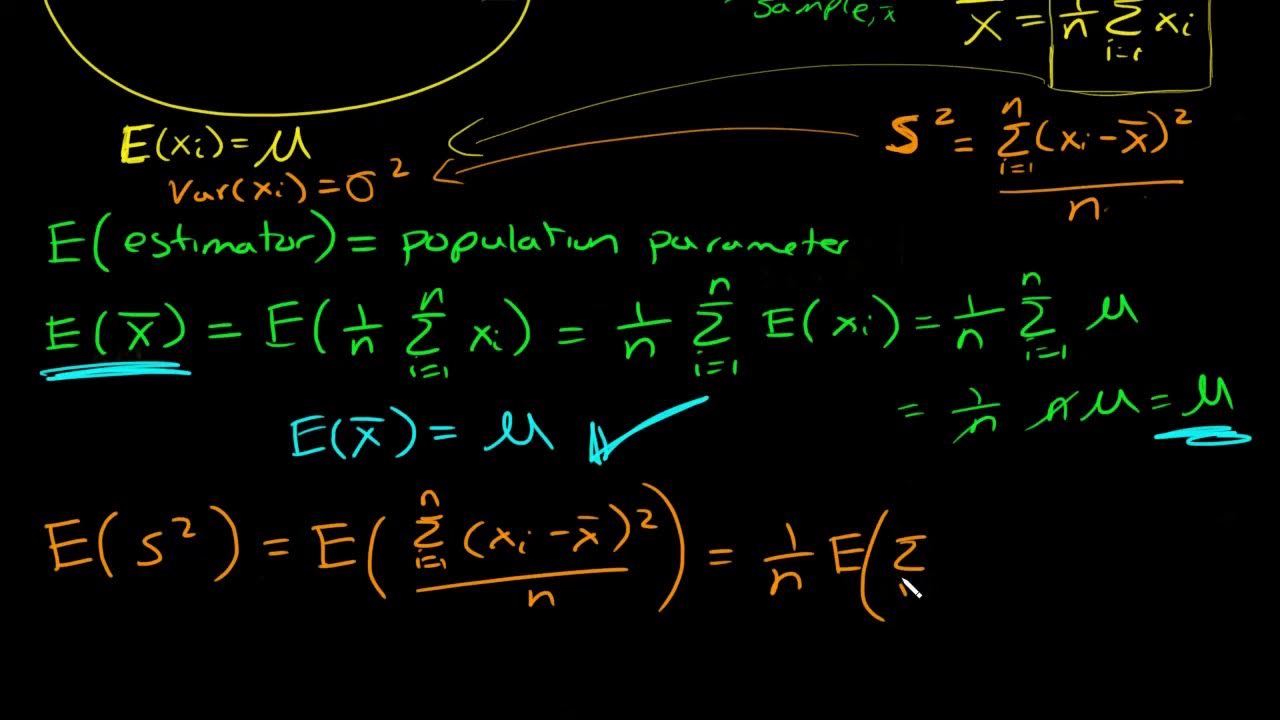
-The population variance is calculated by taking each value in the population, subtracting the mean, squaring the result, summing these values, and then dividing by the population size.
What is the relationship between the sample variance and the population variance in terms of expected value?
-The expected value of the sample variance is equal to the population variance, indicating that the sample variance is a good estimator of the population variance.
Can you explain the process of finding the sample variance for all possible samples of size n=2 from a population with three elements?
-The process involves creating all possible samples of size n=2 with replacement from the population, calculating the mean for each sample, and then using these means to calculate the sample variance for each sample according to the formula s^2 = Σ(xi - mean)^2 / (n-1).
What is the purpose of summarizing the sampling distribution of sample variances in the form of a probability distribution table?
-The purpose of summarizing the sampling distribution in a probability distribution table is to organize the data and facilitate the calculation of the mean of the sample variances, which should be equal to the population variance.
How can you demonstrate that the mean of the sample variances is equal to the population variance?
-You can demonstrate this by calculating the mean of the sample variances obtained from a large number of samples and showing that it matches the population variance.
What is the concept of an unbiased estimator in statistics?
-An unbiased estimator is a statistic that estimates a population parameter without bias; its expected value is equal to the true value of the parameter being estimated.
How does the distribution of sample variances compare to a normal distribution?
-While the distribution of sample variances may resemble a normal distribution, it is typically skewed to the right and does not have the symmetrical bell shape characteristic of a normal distribution.
What is the significance of the sample variance being an unbiased estimator of the population variance?
-The significance is that the sample variance provides a reliable estimate of the population variance, as its mean across all possible samples is equal to the population variance.
Can you provide an example of calculating the population variance for a set of values?
-Yes, for a set of values like {4, 17, 11}, the population variance is calculated by finding the mean (32/3), then for each value subtract the mean, square the result, sum these values, and divide by the number of values in the population (3), resulting in a population variance of 254/9.
How does the concept of sample variance relate to the experiment of rolling a die five times?
-In the experiment of rolling a die five times, the sample variance can be calculated for each set of outcomes. By repeating this experiment many times, one can create a sampling distribution of sample variances, which can be used to estimate the population variance of the outcomes.
What is the population variance for the outcomes of rolling a fair six-sided die?
-The population variance for the outcomes of rolling a fair six-sided die is 35/12 or approximately 2.9167, calculated by taking the equally likely outcomes 1 through 6, subtracting the mean (3.5), squaring the differences, and dividing by the number of outcomes (6).
How can the relative frequency approximation of probability be used to estimate the probabilities in the sampling distribution of sample variances?
-The relative frequency approximation of probability can be used by taking the frequency of each sample variance observed in a large number of trials and dividing it by the total number of trials, which gives an estimate of the probability for each sample variance in the sampling distribution.
Outlines
📚 Introduction to Sample Variance Distribution
This paragraph introduces the concept of the sampling distribution of sample variance, emphasizing its importance in relation to the population variance. It explains that the sample variance (denoted as s^2) is an unbiased estimator of the population variance (σ^2). The paragraph also notes the skewed distribution of sample variances to the right with a long tail and illustrates the process of creating a sampling distribution through an example with a population of size n, randomly selecting n values with replacement, calculating variances for each sample, and analyzing the distribution of these variances.
🔍 Calculating Sample Variance and Its Distribution
The paragraph delves into the process of calculating the sample variance from a given population and creating its sampling distribution. It demonstrates how to find the population variance using a small dataset and then explores all possible samples of size n=2 with replacement to find the sample variance for each. The summary includes the steps for calculating the sample means and variances, the repetition of certain variance values, and the formation of a probability distribution table that shows the mean of the sample variances is equal to the population variance, confirming the unbiased nature of the sample variance as an estimator.
🎲 Example of Sample Variance with Rolling Dice
This paragraph presents an example involving rolling a die five times to illustrate the concept of sample variance. It discusses the calculation of the population variance for the outcomes of rolling a die and the process of determining the sample variance for each set of rolls. The example highlights the probability of achieving a sample variance of zero and other possible variances, emphasizing the discrete nature of the random variable and the construction of a true probability distribution for the sample variances.
📉 Analysis of Sample Variance Distribution in Dice Rolls
The paragraph continues the dice-rolling example, exploring the probabilities associated with different sample variance outcomes. It explains the calculation of the sample variance for various combinations of dice rolls and the probabilities of obtaining specific variances. The summary includes the method for determining the mean of the sample variances and how it relates to the population variance, reinforcing the concept that the sample variance is an unbiased estimator of the population variance.
📊 Empirical Approach to Sample Variance Distribution
This paragraph contrasts the theoretical approach to determining the sample variance distribution with an empirical one. It describes a method where a die is rolled or simulated a large number of times (e.g., 5,000 or 10,000 times) to calculate the sample variance for each instance. The paragraph discusses the resulting distribution of these sample variances and how the mean of these variances approximates the population variance, demonstrating the consistency of the sample variance as an unbiased estimator through empirical evidence.
📉 Final Thoughts on Sample Variance Distribution
The final paragraph wraps up the discussion on the sampling distribution of sample variance. It reiterates that the sample variance is an unbiased estimator of the population variance and highlights the skewed distribution of sample variances to the right. The summary emphasizes the importance of understanding the shape of the distribution and its implications for statistical analysis, providing a conclusion to the video's exploration of this topic.
Mindmap
Keywords
💡Sampling Distribution
💡Sample Variance
💡Population Variance
💡Unbiased Estimator
💡Skewed Distribution
💡Mean of Sample Variances
💡Estimation
💡Probability Distribution Table
💡Sample Size (n)
💡Variance Calculation
💡Rolling a Die
Highlights
The sampling distribution of sample variance (s squared) is the distribution of all possible sample variances from samples of the same size n taken from the same population.
Sample variance (s squared) is an unbiased estimator of the population variance (sigma squared), as its mean equals the population variance.
The distribution of sample variances tends to be skewed to the right with a long right tail.
The expected value of the sample variance is equal to the population variance, confirming its status as a good estimator.
Graphical illustration of the sampling distribution of sample variances and their mean equaling the population variance.
An example demonstrates calculating the population variance from a set of values and finding the sample variances for all possible samples of size n=2.
The population variance is calculated using the mean and the squared deviations from the mean.
All possible samples of size n=2 from a population with three values result in nine different samples due to replacement.
Sample means are calculated for each possible sample, which is essential for determining sample variances.
Sample variances are calculated using the formula involving squared deviations from the sample mean, divided by n-1.
A specific sample with all values the same results in a sample variance of zero, indicating no variation.
Sample variances for different combinations of values are calculated, showing variation from the mean.
A probability distribution table is constructed to summarize the sampling distribution of sample variances.
The mean of the sample variances from the distribution table is computed and shown to equal the population variance.
An example of rolling a die five times illustrates the process of finding the sample variance and its relation to the population variance.
The population variance for rolling a die is calculated based on the equally likely outcomes of 1 to 6.
The concept of an unbiased estimator is reinforced through the example, showing the mean of sample variances equals the population variance.
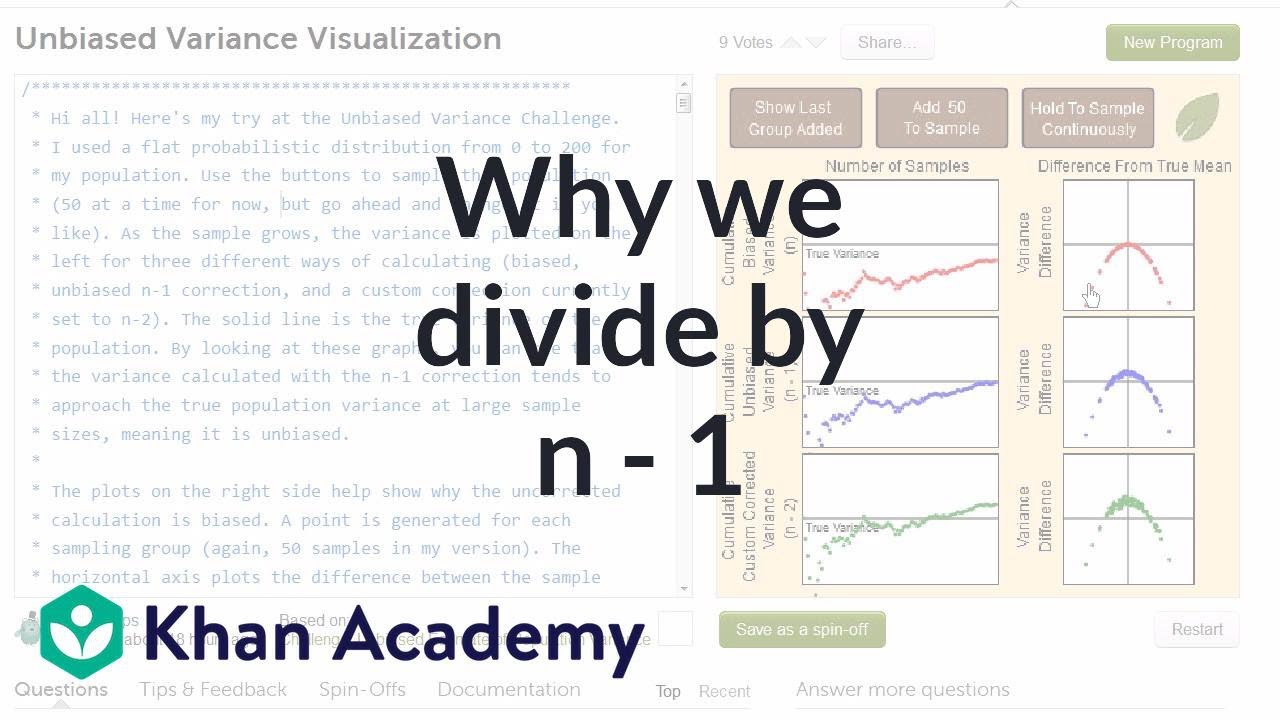
The distribution of sample variances generated from rolling a die 10,000 times approximates the population variance.
The sample variances, despite being unbiased estimators, form a distribution that is skewed to the right, unlike a normal distribution.
Transcripts
Browse More Related Video
Math 14 HW 6.3.7-T Is the sample variance an unbiased estimator of the population variance?
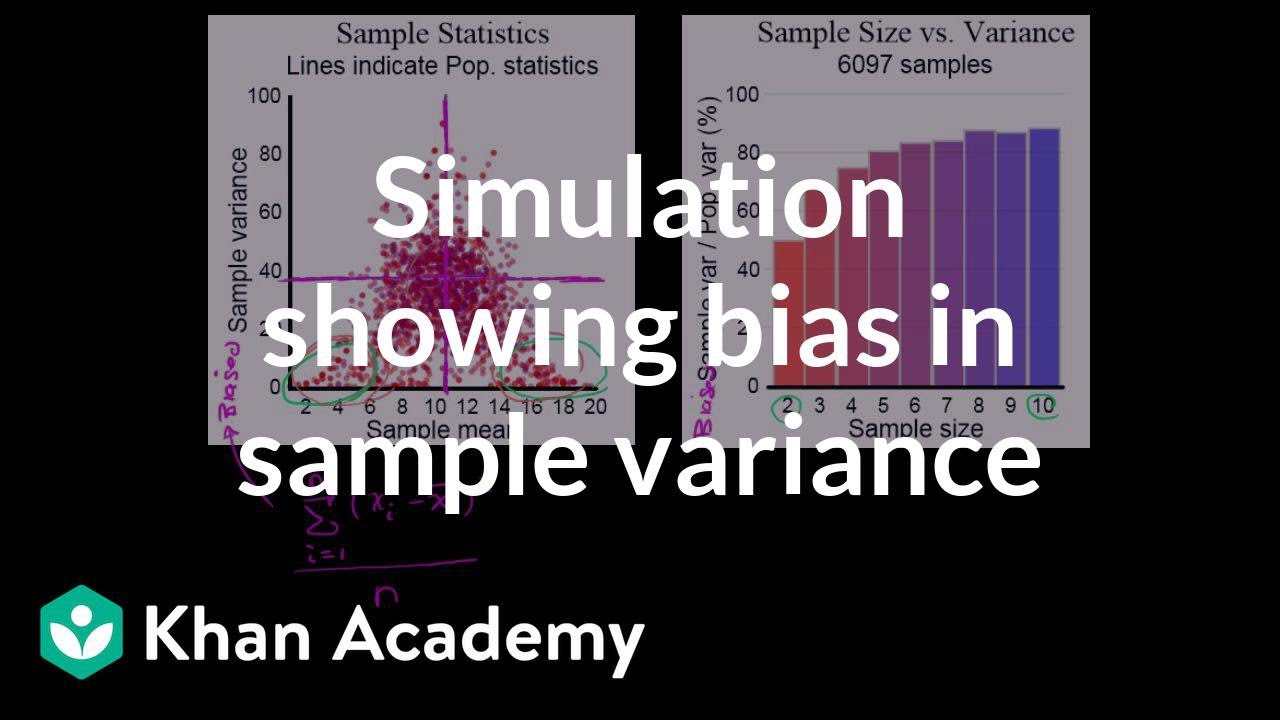
Simulation showing bias in sample variance | Probability and Statistics | Khan Academy
6.3.5 Sampling Distributions and Estimators - Biased and Unbiased Estimators
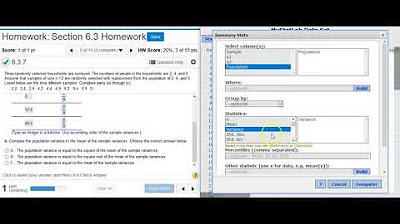
[6.3.7] Creating a variance sampling distribution probability distribution table in StatCrunch
What is an unbiased estimator? Proof sample mean is unbiased and why we divide by n-1 for sample var
Another simulation giving evidence that (n-1) gives us an unbiased estimate of variance
5.0 / 5 (0 votes)
Thanks for rating: