Elementary Stats Lesson #13
TLDRThis lecture introduces the concept of sampling distributions, focusing on the distribution of the sample mean (x-bar), a foundational topic in statistical inference. The instructor explains how sample means, even from non-normal populations, tend to follow a normal distribution as sample size increases, a principle known as the Central Limit Theorem (CLT). The lecture uses examples, such as penny weights and IQ scores, to illustrate how the mean and standard error of the sample mean are calculated, emphasizing the importance of sample size in reducing variability and approaching a normal distribution.
Takeaways
- 📚 The lesson focuses on understanding sampling distributions, particularly for the sample mean (x̄), which is a foundational concept for statistical inference.
- 🔍 The overarching goal of the course is to connect sample statistics, like the sample mean, to population parameters, a process known as statistical inference.
- 📈 Statistics such as the sample mean are random variables with associated probability distributions, which are essential to understand in terms of shape, center, and spread.
- 🌟 The sampling distribution of the sample mean is the probability distribution of all possible sample means, which is crucial for making inferences about the population.
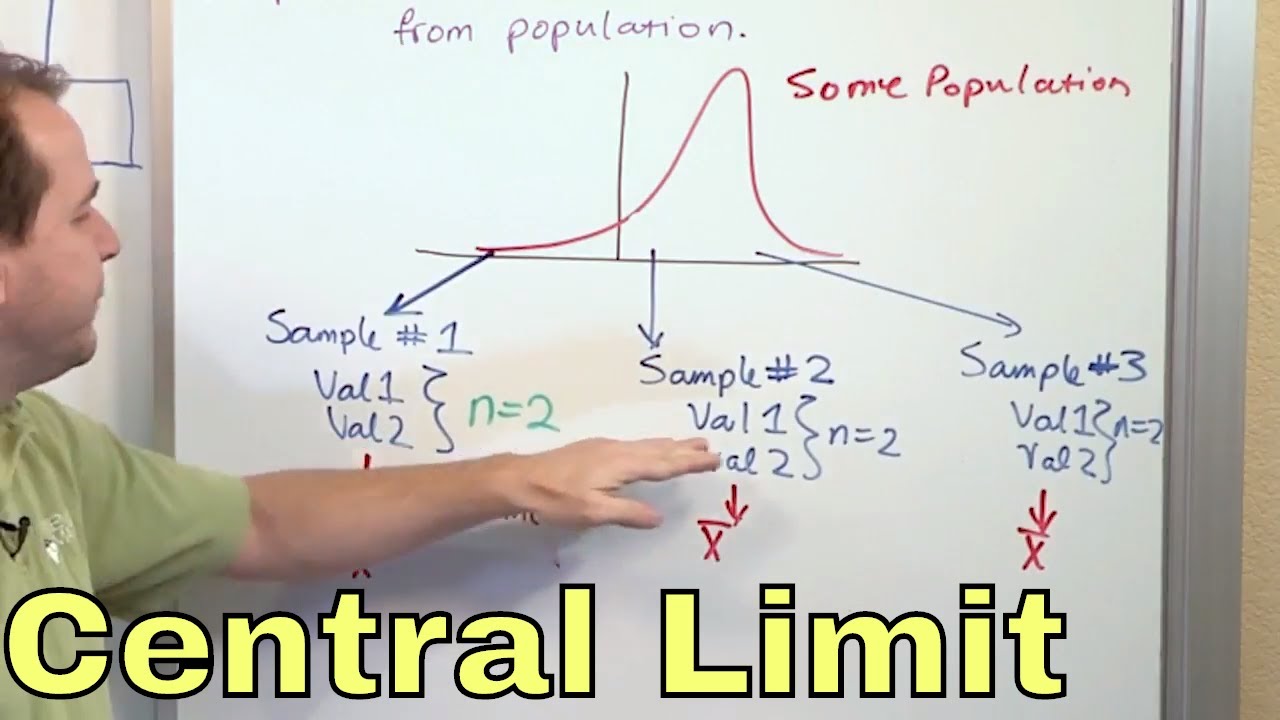
- 📝 The process involves taking a simple random sample, calculating the sample mean, and theoretically repeating this process for all possible samples of a given size.
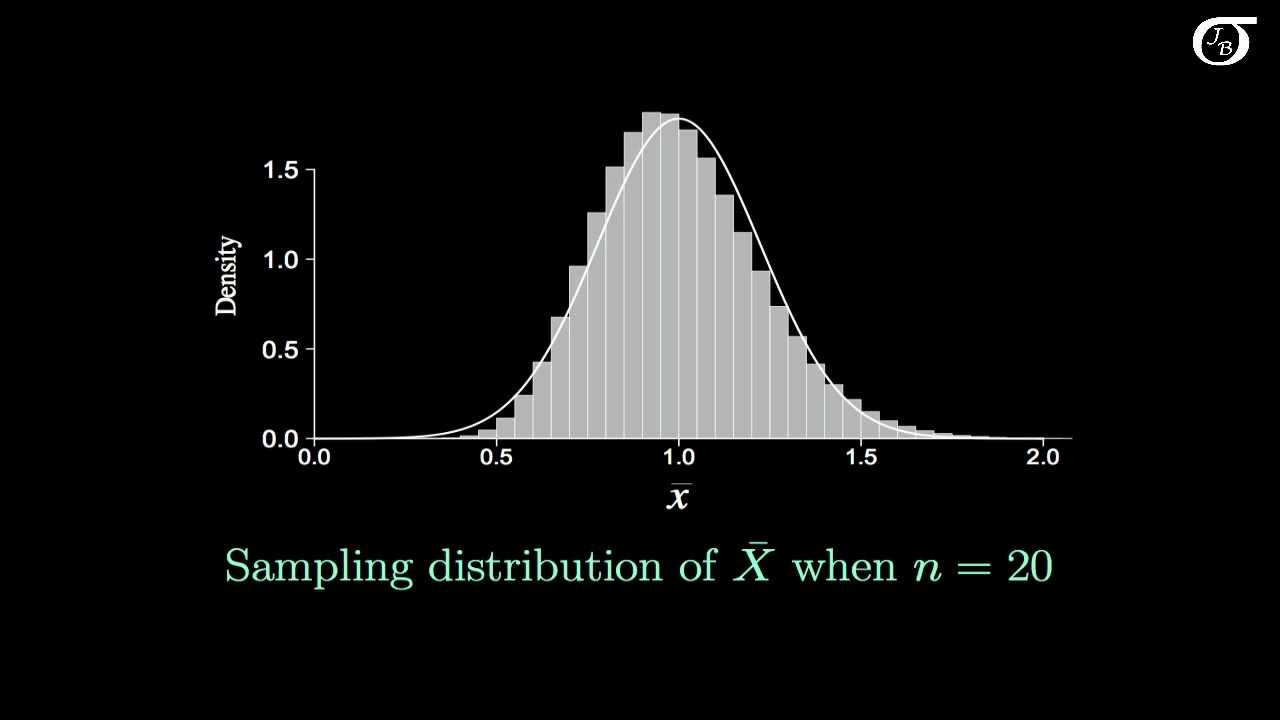
- 📊 A computer simulation is used to illustrate the sampling distribution of the sample mean, demonstrating how it approximates a normal distribution as the sample size increases.
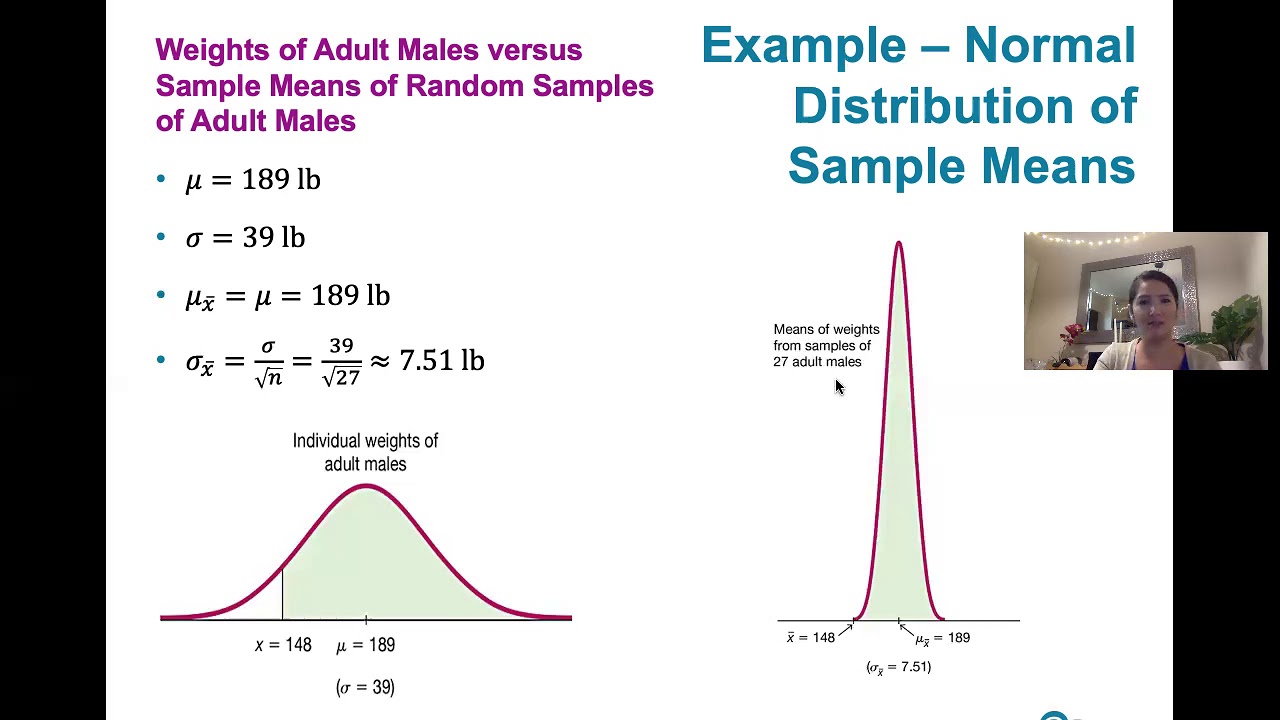
- 📉 The standard deviation of the sample mean (σx̄) is smaller than the standard deviation of individual observations (σ), highlighting that sample means vary less than individuals.
- 🧐 The standard error of the mean is a key concept, representing the standard deviation of the sampling distribution of the sample mean, calculated as σ divided by the square root of the sample size.
- 📚 The Central Limit Theorem (CLT) is a fundamental theorem stating that the sampling distribution of the sample mean will be approximately normal if the sample size is large enough (n ≥ 30), regardless of the population's distribution shape.
- 🤓 The impact of sample size on the shape, center, and spread of the sampling distribution is significant, with larger sample sizes reducing variability and potentially normalizing the distribution.
- 🔑 Understanding the behavior of sample means through their sampling distributions is essential for making statistical inferences and answering probability-related questions about populations.
Q & A
What is the main focus of the lesson in the provided transcript?
-The main focus of the lesson is on sampling distributions, specifically the sampling distribution of the sample mean, also known as x-bar.
What is the technical term for the average obtained from a sample?
-The technical term for the average obtained from a sample is the sample mean, denoted as x-bar.
What is the overarching goal for the semester according to the transcript?
-The overarching goal for the semester is to understand the connection between a sample summary, or statistic, and the population parameter, which is the process of statistical inference.
Why are statistics like the sample mean considered random variables?
-Statistics like the sample mean are considered random variables because their values change from one sample to another, which introduces variability.
What is the significance of understanding the probability distribution of a statistic?
-Understanding the probability distribution of a statistic allows us to know its shape, center, and spread, which is crucial for making inferences about the population from the sample.
What is the relationship between the standard deviation of individual observations and the standard deviation of the sample mean?
-The standard deviation of the sample mean is smaller than the standard deviation of individual observations, and it is calculated as the standard deviation of the population divided by the square root of the sample size.
What is the term used to describe the standard deviation of the sampling distribution of the sample mean?
-The term used to describe the standard deviation of the sampling distribution of the sample mean is the standard error of the mean.
How does the central limit theorem (CLT) relate to the sampling distribution of the sample mean?
-The central limit theorem states that the sampling distribution of the sample mean will have an approximately normal distribution if the population is normal or if the sample size is large enough (greater than or equal to 30), regardless of the population's actual distribution.
What is the impact of increasing the sample size on the standard error of the mean?
-Increasing the sample size decreases the standard error of the mean, leading to less variability in the sample means and a tighter distribution.
Can the central limit theorem be applied even if the population distribution is not normal?
-Yes, the central limit theorem can be applied even if the population distribution is not normal, as long as the sample size is large enough (greater than or equal to 30).
What is the probability calculation for a sample mean being greater than a certain value based on the normal distribution?
-The probability calculation for a sample mean being greater than a certain value is done using the normal cumulative distribution function (CDF), with the specific value as the upper limit and the mean and standard error of the sample mean distribution as parameters.
Outlines
📚 Introduction to Sampling Distributions
The script introduces the concept of sampling distributions, specifically focusing on the sampling distribution for the sample mean (x-bar). It emphasizes the importance of understanding the shape, center, and spread of these distributions. The overarching goal of the semester is to connect sample statistics with population parameters through statistical inference. The lesson also mentions the randomness of sample means due to the variability in different samples, and the significance of this randomness in statistical analysis.
🔍 Exploring the Behavior of Sample Means
This paragraph delves into the theoretical process of understanding the sampling distribution of the sample mean. It uses a computer simulation involving the weights of pennies to illustrate how different sample means can be generated and how they form a distribution. The simulation shows that the distribution of sample means is approximately normal, with the same mean as the population but with less variability, highlighting the concept that sample means vary less than individual observations.
📉 The Impact of Sample Size on Variability
The script discusses how the standard deviation of the sample mean, also known as the standard error, is influenced by the sample size. It explains that the standard error is the standard deviation of the population divided by the square root of the sample size. This relationship is crucial because it shows that larger sample sizes lead to less variability in the sample mean, which is beneficial for statistical analysis.
📈 Standard Error and Sample Size in Practice
The script provides examples of how the standard error and sample size affect the distribution of sample means. It uses the weights of pennies and IQ scores to demonstrate that as the sample size increases, the distribution of sample means becomes more concentrated around the population mean, with less variability. This illustrates the practical application of the concepts discussed in the previous paragraphs.
🤔 Probabilities and Sample Size
This section examines how the probability of certain events changes with different sample sizes. It uses the example of IQ scores to show that the probability of a sample mean exceeding a certain value is much lower than the probability of an individual score doing so. This highlights the impact of sample size on the likelihood of extreme values in the context of sample means.
📊 Understanding the Central Limit Theorem
The script introduces the Central Limit Theorem (CLT), which states that the sampling distribution of the sample mean will be approximately normal if the sample size is large enough (n ≥ 30), regardless of the shape of the population distribution. This is a fundamental concept in statistics that allows for the use of normal distribution models in a wide range of scenarios.
🛠 Applying the Central Limit Theorem
The script applies the Central Limit Theorem to practical examples, such as the average time for oil changes and other scenarios where the population distribution is not necessarily normal. It shows how to calculate the mean and standard error of the sampling distribution of the sample mean, and how these calculations enable the use of normal distribution models for probability analysis.
🔮 Future Directions in Sampling Distributions
The final paragraph looks ahead to future lessons, which will explore the sampling distributions of sample proportions and other statistics. It emphasizes the importance of understanding the behavior of different types of sample statistics and how they relate to population parameters, continuing the theme of statistical inference introduced at the beginning of the script.
Mindmap
Keywords
💡Sampling Distributions
💡Sample Mean (x-bar)
💡Statistical Inference
💡Random Variables
💡Normal Distribution
💡Standard Error of the Mean
💡Central Limit Theorem (CLT)
💡Population Parameter
💡Sample Proportion (p-hat)
💡Standard Deviation
Highlights
Introduction to the second half of the semester focusing on sampling distributions, specifically for the sample mean.
The overarching goal of the course is to link sample statistics to population parameters through statistical inference.
Explanation of the sample mean (x-bar) as a random variable with its own probability distribution.
Sampling distributions are used to understand the shape, center, and spread of the distribution of a sample mean.
The importance of the sample size in determining the behavior of the sample mean's sampling distribution.
Illustration of the sampling distribution process using a computer simulation of penny weights.
The normal distribution of individual penny weights and how it approximates the sampling distribution of the sample mean.
Demonstration that the sample mean's distribution is approximately normal, regardless of the original distribution shape, given a large enough sample size (Central Limit Theorem).
Calculation of the standard error of the mean, showing how it decreases as sample size increases.
The impact of sample size on the variability of the sample mean, with larger samples leading to less variability.
Probability calculations for sample means compared to individuals, showing the decreased likelihood of extreme values in sample means.
Application of the Central Limit Theorem to non-normal populations, illustrating how sample means can approximate a normal distribution with large enough sample sizes.
Examples of calculating probabilities for sample means from populations with known means and standard deviations.
The transition from analyzing individuals to analyzing sample means and the implications for statistical control and inference.
Upcoming lesson预告 on sampling distributions for sample proportions, indicating a continuation of the topic with a focus on binary outcomes.
Summary of the importance of understanding the behavior of sample means in the context of all possible samples for statistical analysis.
Transcripts
Browse More Related Video
Central Limit Theorem & Sampling Distribution Concepts | Statistics Tutorial | MarinStatsLectures
The Sampling Distribution of the Sample Mean
Introduction to the Central Limit Theorem
02 - What is the Central Limit Theorem in Statistics? - Part 1

Elementary Stats Lesson #14
6.4.1 The Central Limit Theorem - What the Central Limit Theorem Says and What It Doesn't Say
5.0 / 5 (0 votes)
Thanks for rating: