Central Limit Theorem & Sampling Distribution Concepts | Statistics Tutorial | MarinStatsLectures
TLDRThis video delves into the concept of a sampling distribution, focusing on how it helps us understand the likelihood of certain sample means occurring given a known population mean. It introduces the idea of the central limit theorem, explaining that with large sample sizes or normally distributed populations, the sampling distribution will be approximately normal. The video also explains the concept of standard error, illustrating how it provides insight into the average deviation of sample means from the true mean, and how it decreases as sample size increases. This foundational knowledge is crucial for statistical inference, including constructing confidence intervals and hypothesis testing.
Takeaways
- 📊 The concept of a sampling distribution is introduced to understand the likelihood of certain sample means occurring if we knew the true population parameters.
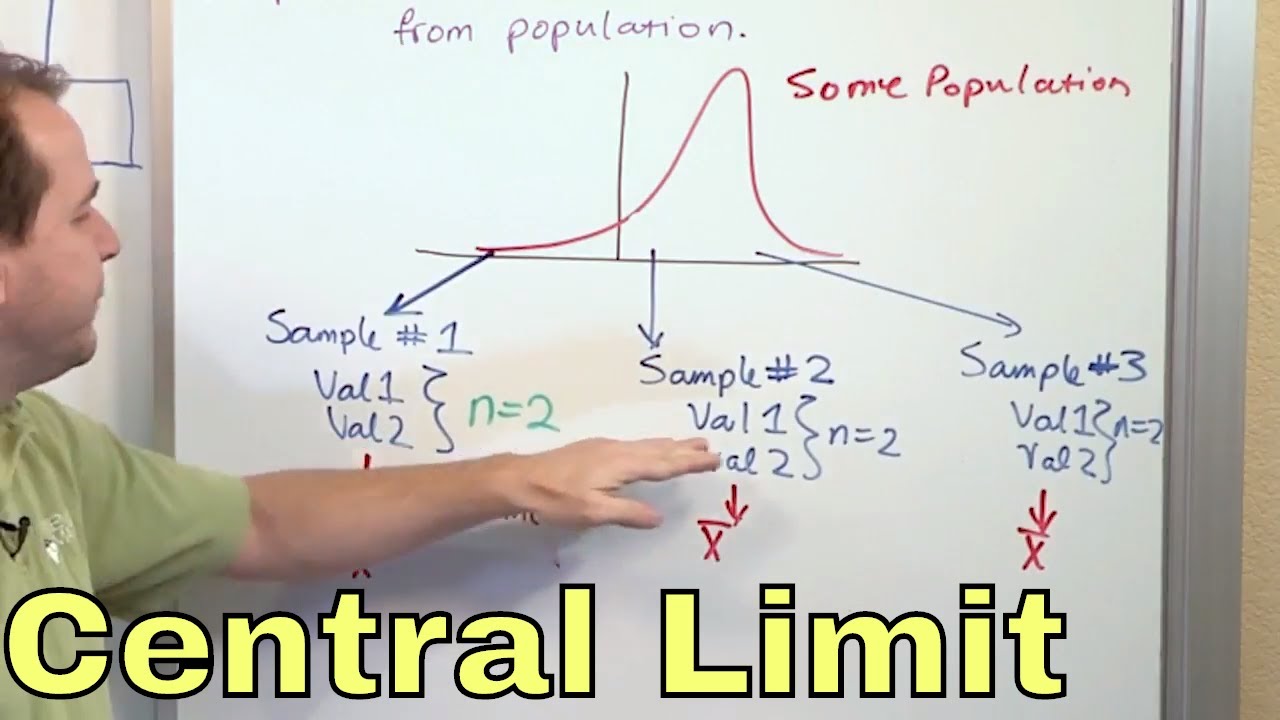
- 🔢 The video discusses the sampling distribution of the mean, which is a theoretical set of all possible sample means we could obtain from a population.
- 🌟 In the pretend world scenario, we assume knowledge of the true population mean (125) and standard deviation (20) for systolic blood pressure.
- 🔍 By taking multiple samples of size 25 from the population, we can observe the distribution of these sample means, which helps in building the sampling distribution.
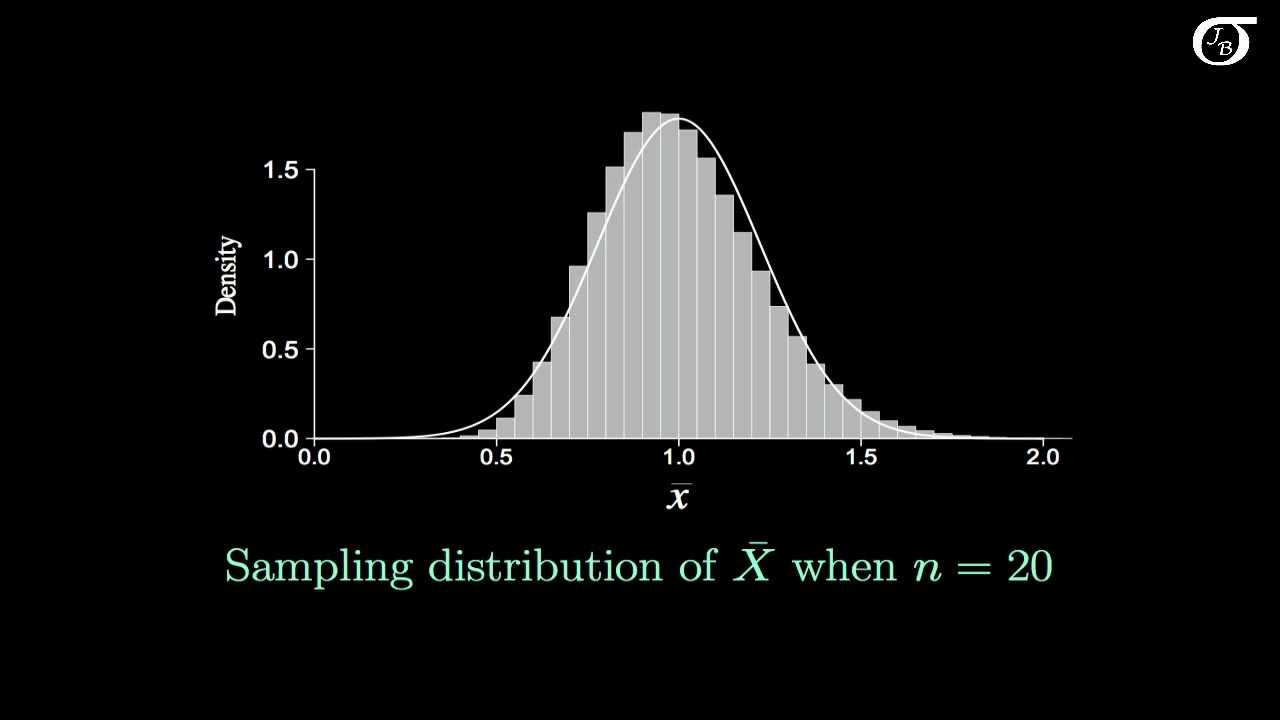
- 📈 The Central Limit Theorem is mentioned, stating that the sampling distribution will be approximately normal if we have a large sample size or if the individual observations are approximately normal.
- 🎯 The expected sample mean is equal to the true population mean, but in reality, it will vary due to sampling error.
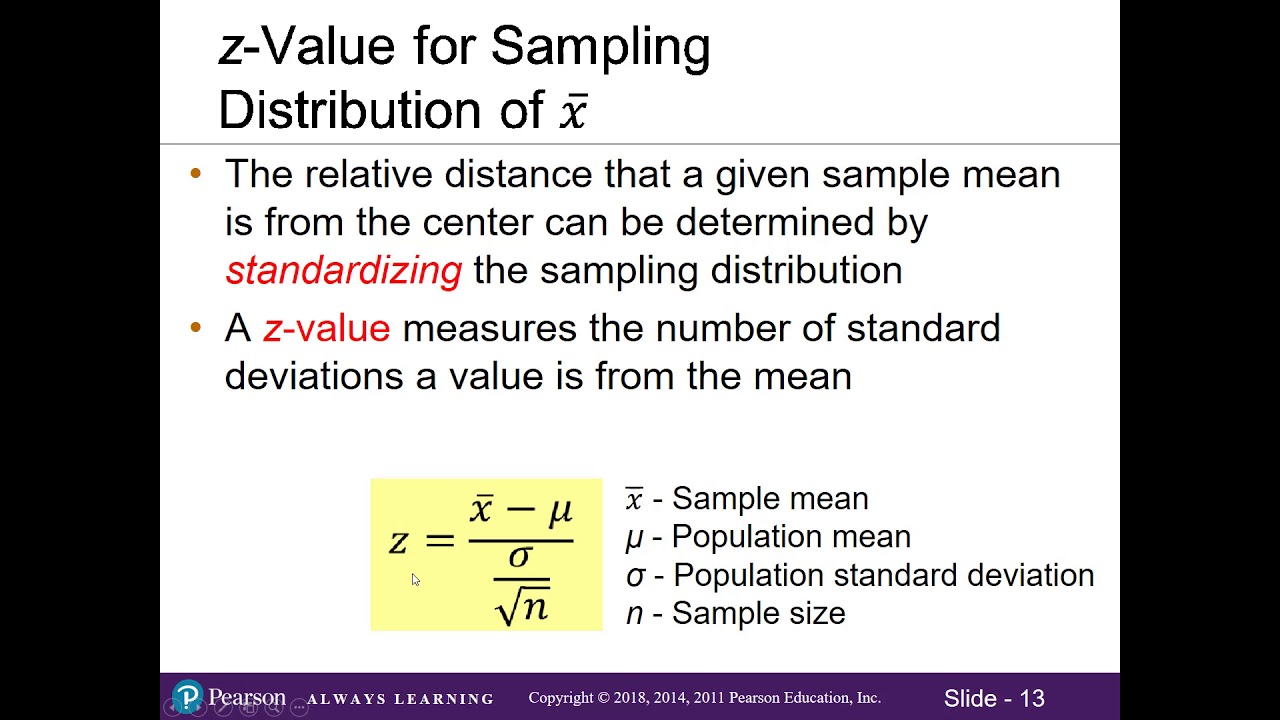
- 📊 The standard deviation of the sample means, also known as the standard error of the mean (SEM), provides an estimate of how much the sample mean will deviate from the true mean on average.
- 🔢 The formula for the standard error is the population standard deviation divided by the square root of the sample size (e.g., 20 / √25 = 4).
- 📊 The video emphasizes that the SEM decreases as the sample size increases, leading to more precise estimates of the true population mean.
- 🔍 The standard error is crucial for statistical inference, allowing us to make statements about the population based on sample data.
- 🚀 The video encourages viewers to explore the concept interactively through a web visualization and previews future content on building confidence intervals and hypothesis testing.
Q & A
What is the main concept being discussed in the video?
-The main concept discussed in the video is the sampling distribution, specifically the sampling distribution of the mean.
Why is understanding the sampling distribution important for statistical inference?
-Understanding the sampling distribution is crucial for statistical inference because it allows us to make statements about the population using sample data, helping us determine how close our sample estimates are to the true population values.
What is the population in the example given in the video?
-In the example, the population is the group of individuals with a skewed right distribution of systolic blood pressure, having a true mean of 125 and a true standard deviation of 20.
How does the central limit theorem relate to the sampling distribution?
-The central limit theorem states that if we sample from a population with independent individuals and either take a large sample size or the distribution of individuals is approximately normal, then the sampling distribution of the sample means will be approximately normal.
What is the expected value of the sample mean in the context of the video?
-In the context of the video, the expected value of the sample mean is equal to the true population mean, which is 125.
What is the standard error of the mean, and how is it calculated?
-The standard error of the mean is the standard deviation of the sampling distribution of the sample mean. It is calculated by dividing the standard deviation of the individual observations by the square root of the sample size, in this case, 20 divided by the square root of 25, which equals 4.
How does the sample size affect the standard error of the mean?
-As the sample size increases, the standard error of the mean decreases, meaning that the estimates become closer to the true population values.
What happens to the distribution of sample means if we take repeated samples from the population?
-If we take repeated samples from the population, the distribution of sample means will form a bell-shaped, approximately normal distribution centered around the true population mean.
What is the practical implication of the standard error in statistical inference?
-The standard error provides an idea of how close or far our sample mean is expected to be from the true population mean on average, which is essential for constructing confidence intervals and hypothesis tests in statistical inference.
How can we visualize the concept of the sampling distribution and standard error?
-We can visualize these concepts using web-based interactive tools that allow us to experiment with different sample sizes and observe how the standard error and distribution of sample means change.
What will be discussed in the following videos after this one?
-In the following videos, the concept of the sampling distribution will be used to build confidence intervals and hypothesis tests, further exploring its application in statistical inference.
Outlines
📊 Building the Concept of Sampling Distribution
This paragraph introduces the concept of a sampling distribution, particularly focusing on the sampling distribution of the mean. It explains how understanding this distribution helps in statistical inference, where sample data is used to make statements about the population. The video uses the example of systolic blood pressure in a population with a known true mean and standard deviation. The concept of multiple possible sample means is introduced, leading to the idea of a sampling distribution, which is the theoretical set of all possible estimates or sample means. The central limit theorem is mentioned, stating that if individuals in the population are independent and the sample size is large or the distribution is approximately normal, the sampling distribution will be approximately normal. The expected sample mean is discussed, along with the concept of the standard error of the mean, which provides an idea of how far the sample mean will deviate from the true mean on average.
🔍 Understanding Standard Error and Its Implications
The second paragraph delves deeper into the standard error of the mean, emphasizing its importance in understanding how close an estimate is to the true value. It reiterates that while the estimate is expected to equal the true value, it will likely vary, and the standard error quantifies this average deviation. The standard error is defined as the standard deviation of the individual observations divided by the square root of the sample size. As the sample size increases, the standard error decreases, indicating that larger samples provide estimates closer to the true values. The paragraph concludes by noting the practical application of these concepts in statistical inference, including building confidence intervals and hypothesis testing, and encourages viewers to explore these ideas further through interactive web visualizations.
Mindmap
Keywords
💡Sampling Distribution
💡Statistical Inference
💡Central Limit Theorem
💡Population Mean
💡Sample Mean
💡Standard Error
💡Standard Deviation
💡Skewed Distribution
💡Population Standard Deviation
💡Sample Size
💡Normal Distribution
Highlights
The video introduces the concept of a sampling distribution.
The sampling distribution is used to understand the likelihood of certain sample statistics.
The video specifically discusses the sampling distribution of the sample mean.
A hypothetical scenario is used to explain the concept, with a population of systolic blood pressure data.
The true mean and standard deviation of the population are given as 125 and 20, respectively.
The video explains that we can think of the sample mean as one of many possible outcomes.
The central limit theorem is introduced, stating that the sampling distribution will be approximately normal under certain conditions.
The expected value of the sample mean is the true mean, but there will be variation.
The standard deviation of the sample means is referred to as the standard error of the mean.
The standard error is calculated as the population standard deviation divided by the square root of the sample size.
The video emphasizes that the sample mean is normally distributed around the true mean.
The standard error provides an idea of how close the sample mean is to the true mean on average.
As sample size increases, the standard error decreases, leading to more accurate estimates.
The video mentions a web visualization for an interactive understanding of the sampling distribution.
The concept of the sampling distribution is crucial for statistical inference, such as building confidence intervals and hypothesis testing.
The video is part of a series that aims to teach statistical concepts and methods.
Transcripts
Browse More Related Video

Elementary Stats Lesson #13
02 - What is the Central Limit Theorem in Statistics? - Part 1
7.2 Sampling Distribution of the Mean (Updated)
The Sampling Distribution of the Sample Mean

Sampling distribution of the sample mean 2 | Probability and Statistics | Khan Academy
Introduction to the Central Limit Theorem
5.0 / 5 (0 votes)
Thanks for rating: