Z-Scores and Percentiles: Crash Course Statistics #18
TLDRThis video explains how to compare things measured on different scales using z-scores. It first shows how to adjust and standardize SAT and ACT scores so they can be directly compared. It then explains how z-scores allow you to compare any normal distribution, like athlete performance or apple weights, in terms of standard deviations from the mean. These normalized scores make it easy to calculate percentiles and determine if a score is extremely high or low compared to a population.
Takeaways
- 😀 Z-scores allow you to compare things measured on different scales by standardizing the distributions.
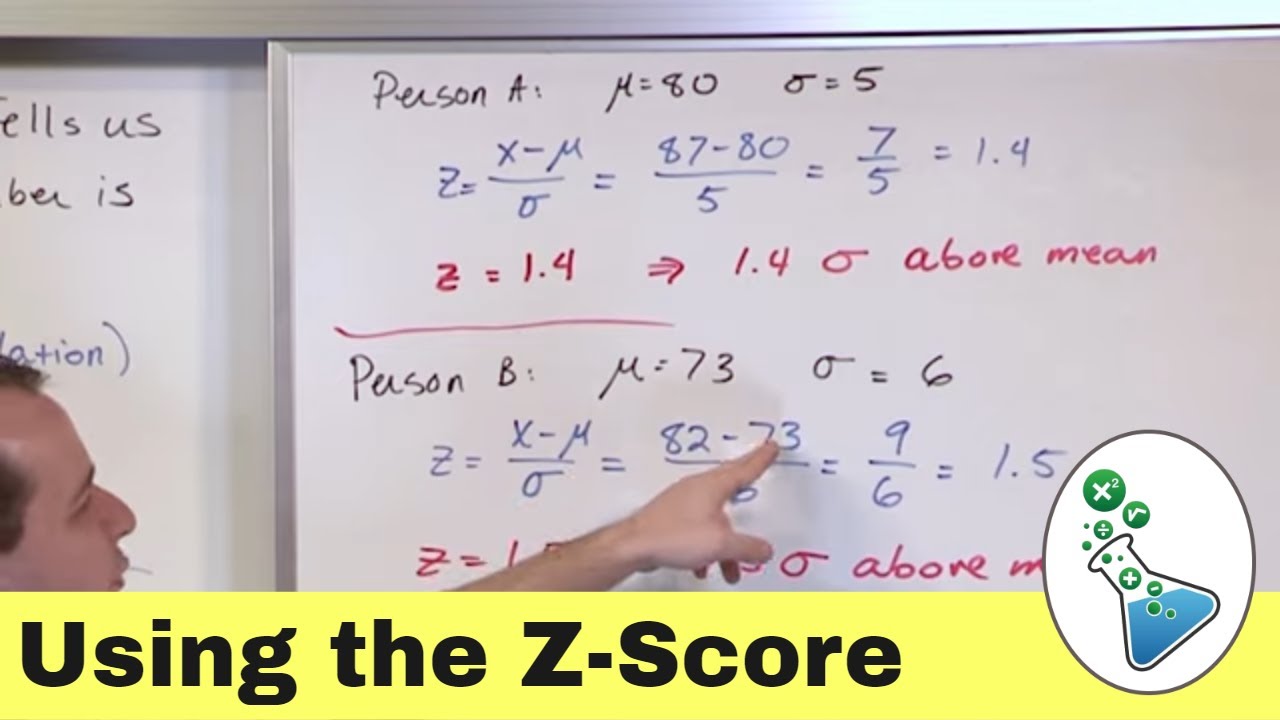
- 📊 To calculate a z-score, subtract the mean from the raw score, then divide by the standard deviation.
- 🔢 Higher z-scores indicate values further from the mean; lower z-scores are closer to the mean.
- 🍎 Z-scores can tell you percentiles - the percentage of values below a certain score.
- 📈 Percentiles are useful for comparing yourself to a population distribution.
- 🏆 Z-scores help compare athletes from different sports by seeing how far above average their stats are.
- 🤔 There's no definitive threshold for determining if a value is extremely high/low based on z-scores.
- 🤯 You can use z-scores to determine if a value is likely from a certain distribution.
- 📉 Standardizing distributions centers them around a mean of 0.
- 😎 Z-scores allow comparisons of 'apples to oranges'.
Q & A
What are two examples given of how statistics can be used to compare things?
-The video gives two examples of using statistics for comparison: 1) Comparing your GPA to the mean or median GPA. 2) Using standard deviation to see if the amount of time people spend on social media is similar or varies a lot.
Why can standardization help when comparing things measured on different scales?
-Standardization converts different scales into a common scale (z-scores) with a mean of 0 and standard deviation of 1. This allows for direct comparison of things like test scores that are originally on different scales.
How can you compare an SAT score to an ACT score?
-To compare SAT and ACT scores: 1) Subtract the mean score of each test to center them around 0. 2) Divide the centered scores by the standard deviation of each test to convert to z-scores. The z-scores can then be directly compared.
What do percentiles tell you?
-Percentiles tell you the percentage of the population that has a score lower than yours. For example, being in the 90th percentile means 90% of scores are below yours.
How can you find the score needed to be in a certain percentile?
-To find the score for a percentile: 1) Find the z-score for that percentile. 2) Multiply the z-score by the standard deviation and add the mean to convert back to the original scale.
How can z-scores help determine if a value is extremely high or low?
-A z-score shows how many standard deviations a value is from the mean. A very high positive or negative z-score indicates an extreme value - though how extreme is somewhat arbitrary.
What factors determine whether a high z-score means a value is not from the distribution?
-To decide if a high z-score means a value is not from the distribution, consider: 1) How extreme the z-score is (e.g. 3.5 vs. 1.65) 2) What the other possible distributions are.
How could z-scores be used to compare athletes to determine the Greatest of All Time?
-To compare athletes across sports, their key stats could be converted to z-scores based on averages in their sport. The athlete with the highest z-score might be considered the Greatest of All Time.
What is the purpose of converting scores to z-scores?
-The main purpose of z-scores is to standardize different scales to a common one with mean 0 and standard deviation 1. This allows for direct numerical comparison of scores from different distributions.
What do higher positive or negative z-scores indicate about a value?
-Higher positive z-scores indicate a value far above the mean, while highly negative z-scores indicate a value far below the mean. Extreme z-scores in either direction indicate rare or unusual values.
Outlines
📺 Introduction to comparing things with statistics and standardizing scores
This first paragraph introduces the video and the concept of using statistics to compare things. It gives examples like GPA and time spent on social media. It then explains that sometimes you want to compare things measured on different scales, which is where standardizing scores by converting to z-scores comes in. Examples are given of SAT and ACT scores, which are standardized so they can be directly compared.
🚀 Converting test scores to z-scores to enable comparison
This paragraph provides a specific example of two students - Tony and Maia - who took different college admission tests (SAT and ACT). It explains the process of standardizing their scores into z-scores by first centering them based on the mean, and then dividing by the standard deviation. This puts the scores on the same scale so they can be easily compared to evaluate who performed better relative to their test.
🥇 Using percentiles and z-scores to determine extreme scores
The last paragraph explains how percentiles can be calculated from z-scores to determine what percentage of people score below a certain value. An example is provided related to qualifying for a video game competition. The concept of what constitutes an extreme z-score is also discussed, along with how to interpret whether something with a very high or low z-score is likely to be from a particular distribution.
Mindmap
Keywords
💡Standardization
💡Z-score
💡Percentiles
💡Standard deviation
💡Normal distribution
💡Mean
💡SAT and ACT
💡Comparing distributions
💡Adjusted scores
💡Extreme scores
Highlights
First significant research finding
Introduction of new theoretical model
Description of innovative experimental method
Transcripts
Browse More Related Video
Intro to Standard Z-Score & Normal Distribution in Statistics
ck12.org normal distribution problems: z-score | Probability and Statistics | Khan Academy
3.3.1 Measures of Relative Standing and Boxplots - Computing and Interpretting z Scores

Z-Scores, Standardization, and the Standard Normal Distribution (5.3)

Elementary Stats Lesson #11

Elementary Statistics - Chapter 6 Normal Probability Distributions Part 1
5.0 / 5 (0 votes)
Thanks for rating: