ck12.org normal distribution problems: z-score | Probability and Statistics | Khan Academy
TLDRThis script from CK12.org's AP Statistics FlexBook explains how to calculate z-scores for various exam grades, given a normal distribution with a mean of 81 and a standard deviation of 6.3. The z-score measures how many standard deviations a value is from the mean. The example problems demonstrate calculating z-scores for grades of 65, 83, 93, and 100, and plotting them on a normal distribution curve. The script also hints at further discussion on interpreting z-scores and probabilities in the next video.
Takeaways
- 📚 The script is from a CK12.org's AP Statistics FlexBook, an open-source textbook used for practicing statistics problems.
- 📈 The grades on a high school statistics midterm are normally distributed with a mean of 81 and a standard deviation of 6.3.
- 🔍 A z-score is a measure of how many standard deviations an element is from the mean.
- 📉 The process of calculating z-scores involves subtracting the mean from a given score and dividing by the standard deviation.
- 📊 The script provides a step-by-step method to calculate z-scores for different exam grades: 65, 83, 93, and 100.
- 📝 For a grade of 65, the z-score is approximately -2.54, indicating it is 2.54 standard deviations below the mean.
- 📌 The grade of 83 has a z-score of about 0.32, which means it is 0.32 standard deviations above the mean.
- 🚀 A score of 93 corresponds to a z-score of 1.9, placing it 1.9 standard deviations above the mean.
- 🌟 The highest score, 100, has a z-score of approximately 3.02, showing it is 3.02 standard deviations above the mean.
- 📉 The script includes a visual representation of the normal distribution curve to illustrate the position of each z-score.
- 🧐 Understanding z-scores helps in interpreting the probability of obtaining certain scores in a normally distributed set of data.
Q & A
What is a z-score and how is it calculated?
-A z-score measures how many standard deviations an element is from the mean. It is calculated by subtracting the mean from the element's value and then dividing by the standard deviation.
What is the mean and standard deviation of the statistics midterm grades mentioned in the script?
-The mean of the statistics midterm grades is 81, and the standard deviation is 6.3.
How does one represent a normal distribution on a chart?
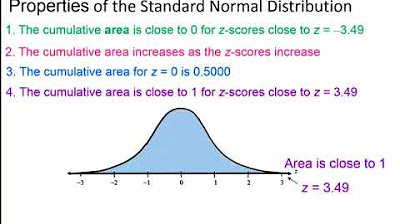
-A normal distribution is typically represented by a bell curve on a chart, with the mean in the center and the standard deviations symmetrically distributed around it.
What is the z-score for a grade of 65 in the given scenario?
-The z-score for a grade of 65 is approximately -2.54, indicating it is 2.54 standard deviations below the mean.
What is the z-score for a grade of 83, and how many standard deviations above the mean does it represent?
-The z-score for a grade of 83 is approximately 0.32, representing 0.32 standard deviations above the mean.
How many standard deviations above the mean is a grade of 93, and what is its z-score?
-A grade of 93 is 1.9 standard deviations above the mean, and its z-score is 1.9.
What is the z-score for a perfect score of 100 on the midterm, and how many standard deviations above the mean does it indicate?
-The z-score for a score of 100 is approximately 3.02, indicating it is 3.02 standard deviations above the mean.
What does the bell curve on the chart represent in terms of probability?
-The bell curve on the chart represents the probability density function of the distribution. The height of the curve at any point corresponds to the likelihood of an element occurring at that value.
Why is the probability of getting a score exactly at the mean not zero in a discrete distribution?
-In a discrete distribution, such as test scores, there is a non-zero probability of getting a score exactly at the mean because the values are counted individually, unlike in a continuous distribution where the probability of getting an exact value is zero.
What does the script imply about the probability of achieving a score of 100 on the midterm?
-The script implies that achieving a score of 100, which is 3.02 standard deviations above the mean, has a very low probability due to its position far on the right tail of the bell curve.
How does the script suggest interpreting z-scores in the context of probability?
-The script suggests interpreting z-scores as a way to understand the likelihood of a score occurring within a normal distribution, with scores further from the mean having lower probabilities of occurring.
Outlines
📚 Understanding Z-Scores in Statistics
This paragraph introduces a statistics problem from CK12.org's AP Statistics FlexBook, an open-source textbook used for practice. The focus is on calculating z-scores for exam grades given a normal distribution with a mean of 81 and a standard deviation of 6.3. The explanation begins with a definition of z-scores as a measure of how many standard deviations a value is from the mean. The speaker demonstrates the calculation of z-scores for different grades, starting with 65, by subtracting the mean from the grade and dividing by the standard deviation, resulting in a z-score of approximately -2.54. The process is illustrated with a bell curve chart, showing the position of each grade relative to the mean and standard deviations.
📉 Calculating Z-Scores for Various Grades
The speaker continues to calculate z-scores for additional exam grades, including 83, 93, and 100. For each grade, the process involves determining how many standard deviations the grade is from the mean. For a grade of 83, the z-score is approximately 0.32, indicating it is a little over one-third of a standard deviation above the mean. For a grade of 93, the z-score is 1.9, placing it 1.9 standard deviations above the mean. Lastly, a perfect score of 100 has a z-score of approximately 3.02, which is nearly 3 standard deviations above the mean. The speaker emphasizes the low probability of achieving such a high score, as indicated by its position on the bell curve, and hints at further discussion of z-scores and probabilities in a subsequent video.
Mindmap
Keywords
💡z-score
💡standard deviation
💡mean
💡normal distribution
💡bell curve
💡calculation
💡probability density function
💡discrete probability function
💡AP statistics
💡FlexBook
💡practice
Highlights
Introduction to the second problem from CK12.org's AP Statistics FlexBook.
Explanation of the textbook's purpose as an open source resource for statistics practice.
Description of the normal distribution of high school statistics midterm grades with a mean of 81 and standard deviation of 6.3.
Definition of a z-score as a measure of standard deviations from the mean.
Illustration of how to calculate the z-score for a grade of 65, resulting in a z-score of approximately -2.54.
Visual representation of the grade distribution with a bell curve and mean at 81.
Calculation of z-scores for grades 83, 93, and 100, emphasizing the process of standard deviation division.
Explanation of how the grade of 83 is 0.32 standard deviations above the mean.
Demonstration of the grade of 93 being 1.9 standard deviations above the mean with a z-score of 1.9.
Calculation of the z-score for a perfect score of 100, revealing it to be 3.02 standard deviations above the mean.
Discussion on the probability implications of z-scores, especially for scores like 100 which are far from the mean.
Clarification on the difference between continuous and discrete probability functions in the context of test scores.
Visual representation of the low probability of achieving a score as high as 100 on the bell curve.
Explanation of the mathematical process of solving for z-scores.
Anticipation of the next video focusing on interpreting z-scores and their associated probabilities.
Emphasis on the practicality of understanding z-scores for statistical analysis in educational settings.
Transcripts
Browse More Related Video

Z-Scores, Standardization, and the Standard Normal Distribution (5.3)

k12.org exercise: Standard normal distribution and the empirical | Khan Academy

Elementary Statistics - Chapter 6 Normal Probability Distributions Part 1

Standard Normal Distribution Tables, Z Scores, Probability & Empirical Rule - Stats

6.1.3 The Standard Normal Distribution - Normal Dist. and Properties of the Standard Normal Dist.

Normal Distribution EXPLAINED with Examples
5.0 / 5 (0 votes)
Thanks for rating: