Intro to Standard Z-Score & Normal Distribution in Statistics
TLDRThe transcript discusses the concept of z-scores, a statistical measure that quantifies the relationship between a data point and the mean of a dataset in terms of standard deviations. It explains the relevance of z-scores in understanding performance, such as test scores, relative to the average. The transcript uses classroom grades as a relatable example, illustrating how z-scores can indicate whether a score is above, below, or near the mean. It further clarifies the calculation of z-scores for both populations and samples, emphasizing their usefulness in comparing data across different sets with varying means and standard deviations.
Takeaways
- 📚 The z-score, also known as the standard score, is a statistical measure that helps to understand how many standard deviations a data point is from the mean.
- 📈 In educational contexts like college, z-scores can be used to gauge a student's performance relative to the class average, considering the average test score and the standard deviation.
- 🎯 Z-scores allow for comparison of data points across different datasets by normalizing them in terms of standard deviations from the mean.
- 📊 A z-score is calculated by the formula Z = (data value - mean) / standard deviation, which can be applied to both populations and samples.
- 🌟 A positive z-score indicates a data point is above the mean, while a negative z-score signifies it is below the mean.
- 🏆 Scoring one standard deviation above the mean is considered a strong performance, as it suggests outperformance relative to peers.
- 🤓 Understanding z-scores helps in interpreting test scores or grades comparatively, rather than just focusing on the absolute value.
- 🔍 The z-score is particularly useful when comparing two different populations or datasets with varying means and standard deviations.
- 📝 The concept of z-scores extends beyond academics to any field where data analysis and comparison are required.
- 📋 The script emphasizes the importance of not just looking at the numerical score but understanding its context in relation to the mean and standard deviation for a more accurate assessment.
- 🚀 Mastery of z-scores is a fundamental step in the study of statistics, which is further explored in the subsequent lessons.
Q & A
What is a z-score and why is it important in understanding data?
-A z-score, also known as a standard score, is a measure that indicates how many standard deviations a data point is from the mean of a dataset. It is important because it allows for the comparison of data points across different datasets, taking into account the mean and standard deviation of each dataset. This helps in understanding the relative performance or position of a data point within the context of its own dataset and when compared to others.
How is a z-score calculated?
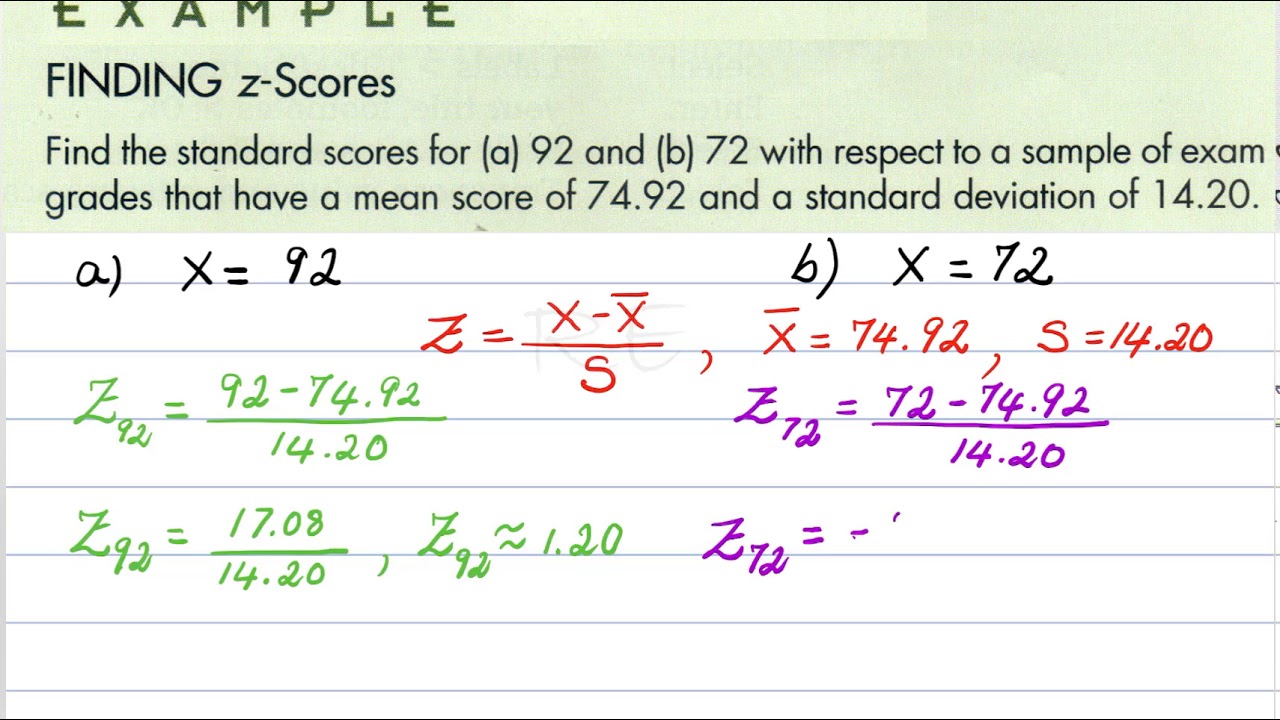
-A z-score is calculated using the formula Z = (X - μ) / σ, where X is the data value, μ is the mean of the dataset, and σ is the standard deviation of the dataset. For a sample, the mean is often denoted as X̄ and the standard deviation as s.
What does a positive z-score indicate?
-A positive z-score indicates that the data point is above the mean of the dataset. The greater the value of the z-score, the further the data point is from the mean, towards the positive end of the distribution.
What does a negative z-score indicate?
-A negative z-score indicates that the data point is below the mean of the dataset. The more negative the z-score, the further the data point is from the mean, towards the negative end of the distribution.
In the context of grades, how does the z-score help in comparing students' performances?
-The z-score helps in comparing students' performances by quantifying how many standard deviations a student's grade is from the class average. This allows for a relative comparison of students' performances, regardless of the absolute grade values, which may vary due to differences in the difficulty of exams or grading standards.
What is the significance of a z-score in relation to the normal distribution of data?
-In a normal distribution, also known as a bell curve, data falling within one standard deviation above or below the mean accounts for approximately 68% of the data. Similarly, data within two standard deviations accounts for about 95%, and within three standard deviations accounts for nearly all of the data, around 99.7%. Knowing the z-score of a data point can thus provide insight into its relative position within the distribution.
How can z-scores be used to compare two students from different classes with different grade scales?
-By calculating the z-scores of the students' grades, we can compare their relative performances based on how many standard deviations they scored above or below their respective class averages. This allows for a fair comparison, as it normalizes the grade values based on the specific distribution of each class.
What is the role of the mean and standard deviation in calculating a z-score?
-The mean provides the central value around which the data is distributed, while the standard deviation measures the spread or variability of the data. The z-score calculation uses both of these values to determine the relative position of a data point within the dataset. The mean is subtracted from the data value to find the deviation from the center, and this deviation is then divided by the standard deviation to express this position in terms of standard deviations.
Can z-scores be used for datasets that are not normally distributed?
-While z-scores are most commonly associated with normally distributed data, they can still be used for other types of datasets. However, the interpretation may not be as straightforward, as the proportions of data within certain ranges of standard deviations may not hold for non-normal distributions. It's important to consider the shape of the distribution when using z-scores outside of the normal distribution context.
What is the practical application of understanding z-scores in the field of statistics?
-Understanding z-scores is crucial in statistics as it allows for the comparison and interpretation of data across different scales and distributions. It is particularly useful in hypothesis testing, where it helps determine if a data point or a set of data points are significantly different from the expected distribution. Z-scores also play a key role in other statistical methods, such as standardizing data for machine learning algorithms, where the data needs to be compared on a common scale.
How does the z-score concept relate to the empirical rule?
-The empirical rule, also known as the 68-95-99.7 rule, is a guideline that describes the distribution of data in a normal distribution. It states that approximately 68% of the data falls within one standard deviation of the mean, 95% within two standard deviations, and 99.7% within three standard deviations. The z-score directly relates to this rule by quantifying the distance from the mean in terms of standard deviations, which helps in applying the empirical rule to understand the proportion of data within certain ranges in a dataset.
Outlines
📚 Introduction to Z-Scores
This paragraph introduces the concept of Z-scores, emphasizing their importance in statistical analysis. Z-scores, despite their unfamiliar name, are straightforward to understand and are used to measure the relationship of a data point to the mean in terms of standard deviations. The analogy of grades in a classroom setting is used to explain how Z-scores can indicate a student's performance relative to their peers. The paragraph also discusses the significance of understanding the mean and standard deviation in evaluating data points and sets the stage for further exploration of Z-scores through examples and problem-solving.
🧮 Calculation and Interpretation of Z-Scores
The paragraph delves into the calculation and interpretation of Z-scores. It explains the formula for calculating Z-scores for both populations and samples, highlighting the use of mu (μ) and sigma (σ) for populations, and X̄ and s for samples. The importance of understanding how many standard deviations a data point is from the mean is emphasized, as it provides a more meaningful comparison across different data sets with varying means and standard deviations. The paragraph also illustrates how Z-scores can be used to compare test scores, demonstrating that a higher score does not necessarily mean better performance without considering the context of the mean and standard deviation.
🏆 Comparing Performance Using Z-Scores
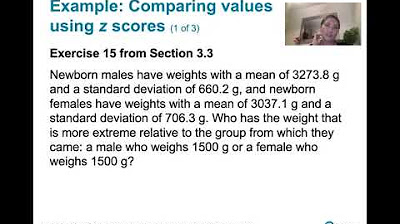
This section uses examples to compare performance using Z-scores. It contrasts the scores of two individuals from different classes, demonstrating how Z-scores provide a more accurate measure of performance relative to their respective class averages. The paragraph clarifies that a higher Z-score indicates better performance, with a score of one standard deviation above the mean being a significant achievement. It also addresses the possibility of negative Z-scores, which represent data points below the mean, and reinforces the importance of Z-scores in comparing and understanding data across different contexts.
📈 Mastering Statistics: Z-Scores and Data Analysis
The final paragraph summarizes the key concepts covered in the lesson, emphasizing the importance of understanding Z-scores in the context of statistics. It reviews the basics of populations and samples, the calculation of mean and standard deviation, and the use of Z-scores in data analysis. The paragraph also mentions various graphical representations of data, such as histograms and box plots. It concludes by encouraging learners to apply their knowledge of Z-scores and other statistical concepts in future lessons, where they will estimate and predict outcomes based on their data.
Mindmap
Keywords
💡z-score
💡standard deviation
💡mean
💡grade comparison
💡normal distribution
💡bell curve
💡data analysis
💡statistical significance
💡population and sample
💡outliers
💡histogram
💡box and whisker plots
Highlights
The z-score is a crucial concept in statistics that helps to understand the relationship of a data point to the mean in terms of standard deviations.
Z-score, despite its complex name, is a simple concept that can be understood by relating it to common experiences such as grades in a classroom.
Understanding z-scores allows for the comparison of data points across different datasets, providing a standardized measure of how far a data point is from the mean.
The z-score is calculated by subtracting the mean from a data point and dividing the result by the standard deviation.
A z-score indicates how many standard deviations a data point is from the mean, which is essential for interpreting the data in a broader context.
In a normally distributed dataset, a z-score can help identify the proportion of data points that fall within a certain range.
A z-score of one or more indicates that a data point is above the mean, while a negative z-score suggests that it is below the mean.
Z-scores can be used to compare the performance of individuals in different classes or populations, even when the absolute scores differ.
The z-score is particularly useful in educational settings for understanding a student's performance relative to their peers and the distribution of grades.
The concept of z-scores extends beyond academics to various fields where comparing data points against a mean is essential.
Z-scores provide a more nuanced understanding of a data point's position relative to the mean, rather than just the absolute difference.
The z-score calculation is the same whether dealing with a population or a sample, with the only difference being the symbols used for the mean and standard deviation.
In a dataset with a large standard deviation, even a high absolute score may not indicate a significant deviation from the mean, as the z-score reveals the true position.
Z-scores can be particularly insightful in educational assessments, helping to identify students who are excelling beyond their peers.
Understanding z-scores is fundamental to mastering statistics, as it forms the basis for further analysis and interpretation of data.
Transcripts
Browse More Related Video

Statistics 101: Understanding Z-scores
Math 20 Lesson 3.5 Descriptive Measures for Populations, Z score Video 3
3.3.1 Measures of Relative Standing and Boxplots - Computing and Interpretting z Scores
ck12.org normal distribution problems: z-score | Probability and Statistics | Khan Academy
Z-Scores and Percentiles: Crash Course Statistics #18

Elementary Statistics - Chapter 6 Normal Probability Distributions Part 1
5.0 / 5 (0 votes)
Thanks for rating: