Z-Scores, Standardization, and the Standard Normal Distribution (5.3)
TLDRThis video tutorial introduces z-scores and the standardization process, essential for calculating exact proportions using the standard normal distribution. It explains how a z-score indicates the distance of an observation from the mean in standard deviations and demonstrates using a z-table to find the area under the curve. The video also covers the standardization formula, transforming any normal distribution into a standard normal distribution, and provides examples of calculating proportions for exam scores and students' heights, illustrating the practical application of these concepts.
Takeaways
- 📈 The standard normal distribution has a mean of 0 and a standard deviation of 1.
- 📊 Z-scores indicate how many standard deviations an observation is from the mean.
- 📏 A z-score of -2 means the observation is 2 standard deviations left of the mean, while a z-score of 1.5 is 1.5 standard deviations right of the mean.
- 📋 The z-score table (standard normal table) helps calculate the area to the left of any z-score.
- ➕ To find the area to the right of a z-score, subtract the table value from 1.
- 🔄 Standardization transforms any normal distribution to the standard normal distribution, with a mean of 0 and standard deviation of 1.
- 🧮 The formula for standardization is: z = (X - μ) / σ.
- 🎓 Example: For a normal distribution of exam scores with mean 60 and standard deviation 10, converting to the standard normal distribution changes these values to z-scores.
- 📚 Calculating the proportion of students scoring below a certain value involves converting the score to a z-score and using the z-score table.
- 📏 Example: For heights of students with mean 5.5 feet and standard deviation 0.5 feet, the proportion of students between certain heights can be found by converting the heights to z-scores and using the z-score table.
Q & A
What is the standard normal distribution?
-The standard normal distribution is a special type of normal distribution with a mean (mu) of 0 and a standard deviation (sigma) of 1. It is always centered at 0, and each number on the horizontal axis corresponds to a z-score.
What does a z-score represent?
-A z-score indicates how many standard deviations an observation is from the mean. For example, a z-score of -2 means the observation is 2 standard deviations below the mean, while a z-score of 1.5 indicates it is 1.5 standard deviations above the mean.
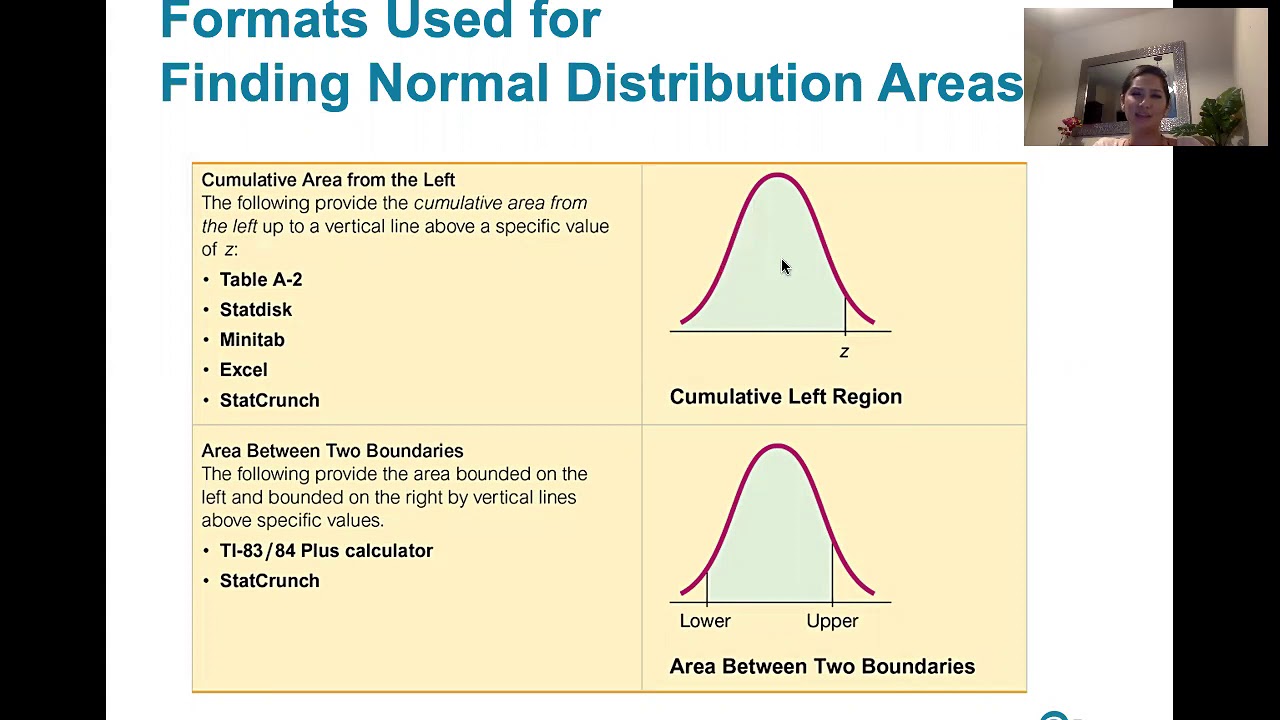
How can we find the exact area associated with a specific z-score?
-We can find the exact area associated with a specific z-score using a z-score table, also known as the standard normal table, which provides the total amount of area contained to the left side of any z-value.
What is the proportion of Z less than negative one point nine five according to the z-score table?
-The proportion of Z less than negative one point nine five is 0.0256, as indicated by the z-score table.
How can we determine the area to the right of a z-score?
-To determine the area to the right of a z-score, we take 1 minus the area that corresponds to that z-value from the z-score table.
What is the area to the right of a z-score of 0.57?
-The area to the right of a z-score of 0.57 is 0.2843, which is calculated by subtracting the area to the left (0.7157) from 1.
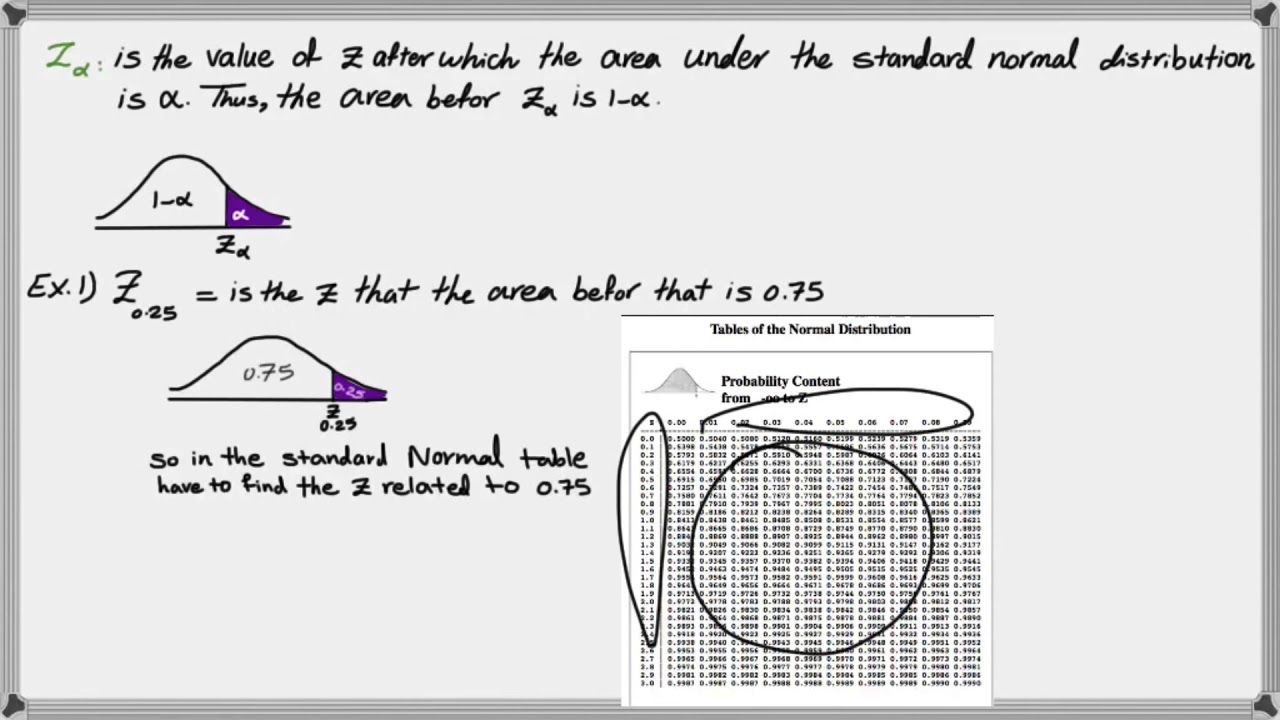
What is a reverse look-up in the context of the z-score table?
-A reverse look-up using the z-score table means using the table to find out what z-score corresponds to a specific area. For example, to find the z-score associated with an area of 0.8426 to the left, we look up 0.8426 in the table to find the corresponding z-score.
What is the purpose of standardization in normal distribution?
-Standardization allows any normal distribution, regardless of its mean (mu) and standard deviation (sigma), to be transformed into the standard normal distribution with a mean of zero and a standard deviation of one. This makes it easier to calculate exact areas using the z-score table.
What is the formula used for standardization in normal distribution?
-The standardization formula is z = (X - mu) / sigma, where z is the z-score, X is the observation, mu is the population mean, and sigma is the population standard deviation.
How can we find the proportion of students scoring less than 49 on an exam with a mean of 60 and a standard deviation of 10?
-First, we standardize the distribution using the given mean and standard deviation. Then, we plug in 49 into the standardization formula to get a z-score of -1.1. Using the z-score table, we find that the proportion of Z less than -1.1 is 0.1357, which is the same proportion of students scoring less than 49.
What is the proportion of students between 5.81 feet and 6.3 feet tall if the height distribution has a mean of 5.5 feet and a standard deviation of 0.5 feet?
-We standardize the distribution to find the z-scores for 5.81 feet (z = 0.62) and 6.3 feet (z = 1.6). Using the z-score table, we find the areas corresponding to these z-scores (0.7304 for z = 0.62 and 0.9452 for z = 1.6). The proportion of students between these heights is the difference between these areas, which is 0.2148.
Outlines
📊 Understanding Z-Scores and Standard Normal Distribution
This paragraph introduces the concept of Z-scores and the standard normal distribution. It explains that the standard normal distribution is a unique bell-shaped curve with a mean of 0 and a standard deviation of 1, which is always centered at zero. The Z-score is a measure indicating how many standard deviations an observation is from the mean. The paragraph also explains how to use the Z-score table to find the exact area associated with a specific Z-score, either to the left or right of the mean. It demonstrates the process of standardization, which converts any normal distribution into the standard normal distribution, allowing for the use of the Z-score table to calculate exact areas for any normally distributed data set.
📚 Applying Standardization to Calculate Proportions in Normal Distributions
The second paragraph delves into practical examples of how to apply the standardization process to calculate proportions within normal distributions. It first illustrates how to find the proportion of exam scores below a certain threshold by converting raw scores into Z-scores and then using the Z-score table to determine the corresponding area. The paragraph then provides an example involving the heights of university students, showing how to calculate the proportion of students within a specific height range by standardizing the data and using the Z-score table. The summary also includes the formula for standardization and emphasizes the importance of understanding the mean and standard deviation in the context of normal distributions.
Mindmap
Keywords
💡Z-scores
💡Standard Normal Distribution
💡Mean (mu)
💡Standard Deviation (sigma)
💡Z-score Table
💡Proportion
💡Area Under the Curve
💡Standardization
💡Observation
💡Density Curve
💡Reverse Look-Up
Highlights
The video teaches about z-scores and standardization in the context of the standard normal distribution.
The standard normal distribution is characterized by a mean of 0 and a standard deviation of 1.
Z-scores indicate how many standard deviations an observation is from the mean.
Z-score tables, also known as standard normal tables, are used to find the area associated with a specific z-score.
The proportion of Z less than a certain value can be found using the z-score table.
The area to the right of any z-score can be determined by subtracting the corresponding area from 1.
The z-score table can be used for reverse look-up to find the z-score associated with a specific area.
Any normal distribution can be transformed into the standard normal distribution through a process called standardization.
Standardization allows the use of the z-score table for exact area calculations in any normally distributed population.
The formula for standardization is given as z = (X - μ) / σ.
An example is provided using final chemistry exam data with a mean of 60 and a standard deviation of 10.
The process of converting a normal distribution to the standard normal distribution is illustrated with an example.
The proportion of students scoring less than 49 on an exam is calculated using the standardization formula and z-score table.
The heights of students at a university are normally distributed with a mean of 5.5 feet and a standard deviation of 0.5 feet.
The proportion of students between 5.81 feet and 6.3 feet tall is calculated using the standardization process.
The final example demonstrates how to find the proportion of values between two z-scores using the standard normal table.
Support for the video creators is encouraged through Patreon, and additional resources are available on their website.
Transcripts
Browse More Related Video

Elementary Statistics - Chapter 6 Normal Probability Distributions Part 1
ck12.org normal distribution problems: z-score | Probability and Statistics | Khan Academy

Elementary Stats Lesson #11

Find the z-score given the confidence level
6.1.4 The Standard Normal Distribution - Given a range of z scores, find areas or probabilities.
How to find critical Z value (Z alpha)
5.0 / 5 (0 votes)
Thanks for rating: