Student's T Distribution
TLDRWilliam Gosset, known as 'Student', developed statistical methods for selecting the best barley varieties at Guinness. His work on small sample sizes led to the creation of the Student's t-distribution, a significant advancement in statistics for inference with unknown population variance. The t-distribution, with its fatter tails, allows for higher variable dispersion and uncertainty. It's calculated using a formula similar to the z-statistic, considering degrees of freedom, typically n-1. The t-table, like the z-table, is used for inference, becoming similar to the z-table after 30 degrees of freedom, indicating that larger samples approach normal distribution values.
Takeaways
- 📚 William Gosset, an English statistician at Guinness, developed methods for selecting high-yielding barley varieties.
- 🔍 Gosset sought efficient ways to make predictions from small samples, as large samples were tedious.
- 🎭 Due to company policy, Gosset published his work under the pseudonym 'Student'.
- 📈 Ronald Fisher, Gosset's friend and a renowned statistician, built upon Gosset's work and introduced the t-statistic.
- 🌟 The Student’s t-distribution is a milestone in statistics, facilitating inference from small samples with unknown variance.
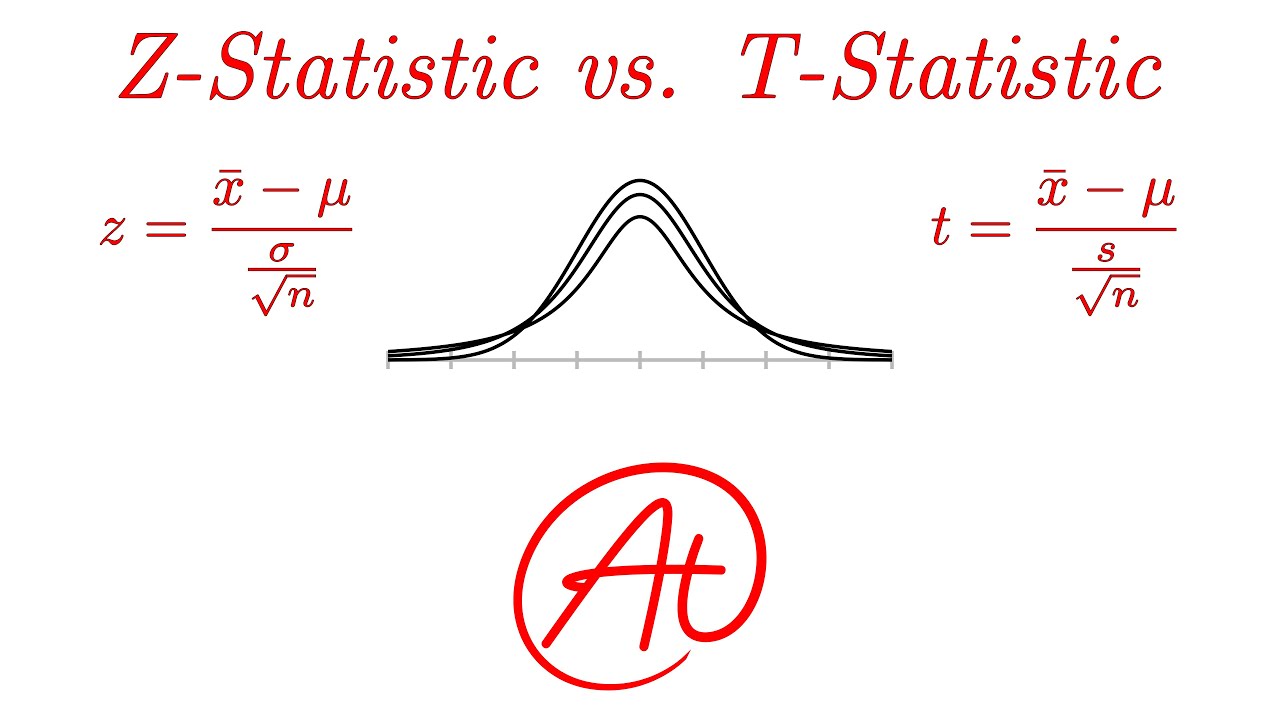
- 📊 The t-distribution resembles a normal distribution but has fatter tails, indicating greater variability and uncertainty.
- 🔢 The t-statistic formula involves the sample mean, population mean, and standard error of the sample, with n-1 degrees of freedom.
- 📚 The t-statistic is analogous to the z-statistic, serving as an approximation for the normal distribution under certain conditions.
- 🔑 Degrees of freedom in the t-distribution are typically n-1, where n is the sample size.
- 📉 The t-distribution table is structured with rows for degrees of freedom and columns for different alpha levels.
- 🔄 Beyond 30 degrees of freedom, the t-distribution approaches the z-distribution, making the z-table applicable for larger samples.
- 🚀 The script hints at a forthcoming practical application of the t-distribution in the next lecture.
Q & A
Who was William Gosset and what was his professional background?
-William Gosset was an English statistician who worked for the Guinness brewery. He developed methods for selecting high-yielding barley varieties, which are crucial for beer production.
Why did Gosset find big samples tedious and what solution did he develop?
-Gosset found big samples tedious because they were time-consuming to process. He developed a method to extract small samples that could still provide meaningful statistical predictions.
What is the significance of Gosset's work being published under a pen name?
-Due to the Guinness company policy, Gosset was not allowed to use his real name in publications. All his work was published under the pen name 'Student', which has become synonymous with his contributions to statistics.
Who is Ronald Fisher and how did he contribute to Gosset's work?
-Ronald Fisher was a famous statistician and a friend of Gosset. He built upon Gosset's findings and introduced the t-statistic, which is named after Gosset's pen name, Student.
What is the importance of the Student’s t distribution in statistics?
-The Student’s t distribution is significant because it allows statistical inference through small samples when the population variance is unknown, addressing a common challenge in many statistical problems.
How does the Student’s t distribution differ visually from the normal distribution?
-The Student’s t distribution is similar to the normal distribution but has fatter tails, indicating a higher dispersion of variables due to increased uncertainty.
What is the relationship between the t-statistic and the Student’s t distribution?
-The t-statistic is related to the Student’s t distribution in the same way that the z-statistic is related to the standard normal distribution. It is used for making inferences from sample data.
What is the formula for calculating the t-statistic?
-The t-statistic is calculated with the formula t = (sample mean - population mean) / (standard error of the sample), where the t has n-1 degrees of freedom and a significance level of alpha.
What are degrees of freedom and how are they determined in the context of the t-statistic?
-Degrees of freedom refer to the number of independent values in a set that can vary freely. For a sample of n, the degrees of freedom are n-1, which is used in the calculation of the t-statistic.
Why does the t-statistic table become similar to the z-statistic table after a certain point?
-After 30 degrees of freedom, the t-statistic table becomes almost identical to the z-statistic table because as the sample size increases, the distribution of the sample means approaches a normal distribution.
What is the common rule of thumb for when to use the z-table instead of the t-table?
-A common rule of thumb is to use the z-table instead of the t-table for samples containing more than 50 observations, as the t-distribution becomes more normal with larger sample sizes.
Outlines
📚 Introduction to William Gosset and the Student's t-distribution
This paragraph introduces William Gosset, an English statistician who worked for Guinness and developed methods for selecting the best barley varieties for beer production. Gosset sought efficient ways to make predictions from small samples, which led to his work under the pseudonym 'Student.' His friend, Ronald Fisher, built upon Gosset's findings and introduced the t-statistic, which is crucial for making inferences from small samples with unknown population variance. The paragraph also explains the visual characteristics of the Student's t-distribution, its relation to the normal distribution, and its significance in statistical analysis.
Mindmap
Keywords
💡William Gosset
💡Barley
💡Small samples
💡Meaningful predictions
💡Ronald Fisher
💡t-statistic
💡Student’s t distribution
💡Degrees of freedom
💡Standard error of the sample
💡Significance level
💡t-table
Highlights
William Gosset was an English statistician who developed methods for selecting the best yielding varieties of barley for beer production.
Gosset found big samples tedious and sought a way to extract small samples for meaningful predictions.
He published papers under the pen name 'Student' due to Guinness company policy.
Ronald Fisher built upon Gosset's work and introduced the t-statistic, which is still named 'Student’s t'.
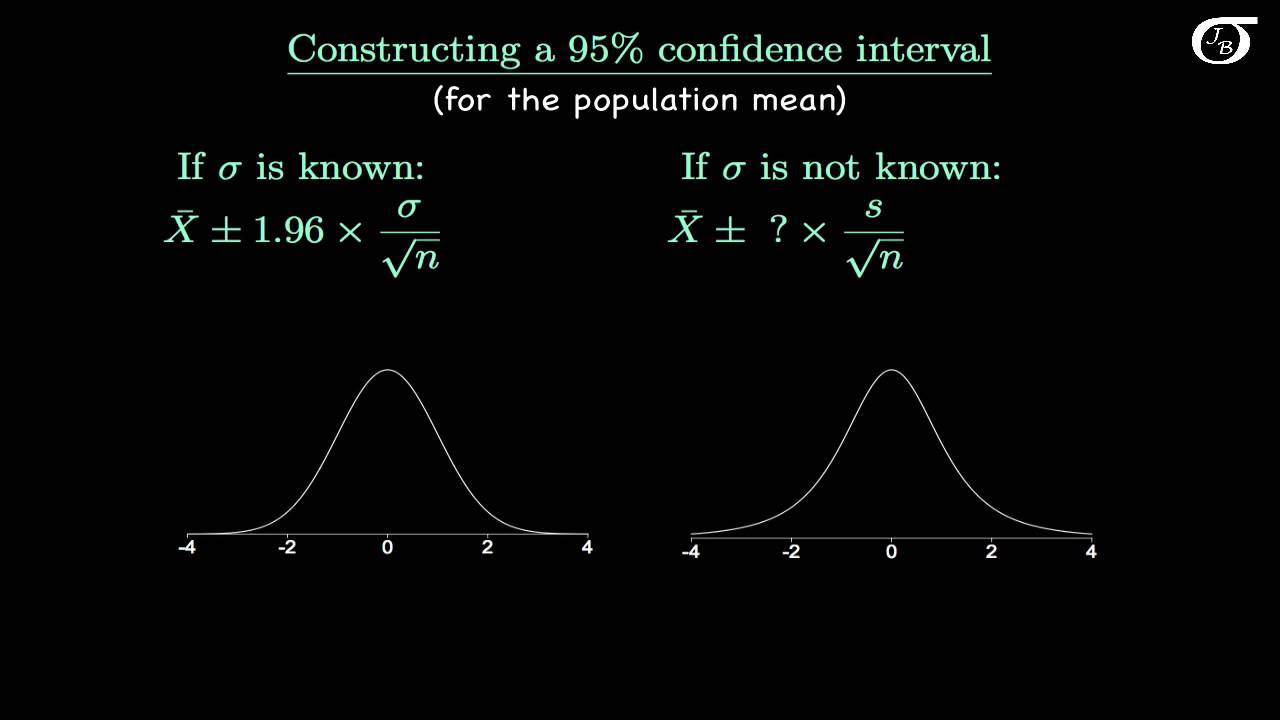
Student’s t distribution is a breakthrough in statistics for inference through small samples with unknown population variance.
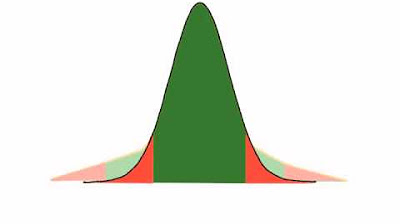
The t-distribution has fatter tails than the normal distribution, allowing for higher dispersion and more uncertainty.
The t-statistic formula involves degrees of freedom and a significance level, similar to the z-statistic.
The t-statistic is calculated with the sample mean, population mean, and standard error of the sample.
The t-statistic table is used for different degrees of freedom, abbreviated as d.f.
After the 30th row, the t-statistic table values are almost the same as the z-statistic.
For samples with more than 50 observations, the z-table is used instead of the t-table.
The t-distribution is an important part of statistical problems and this course's curriculum.
Gosset's work is still relevant today, contributing to modern statistical methods.
The t-statistic is related to the standard normal distribution, serving as an approximation.
The degrees of freedom for a sample of n are n-1, affecting the t-statistic calculation.
A sample of 20 observations has 19 degrees of freedom, impacting the t-statistic's application.
The upcoming lecture will apply the newly learned knowledge of t-statistics in practice.
Transcripts
Browse More Related Video
Introduction to the t Distribution (non-technical)
Z-statistics vs. T-statistics | Inferential statistics | Probability and Statistics | Khan Academy
t-distribution in Statistics and Probability | Statistics Tutorial #9 | MarinStatsLectures
How to calculate t distributions
Z-Statistics vs. T-Statistics EXPLAINED in 4 Minutes
What is the t-distribution? An extensive guide!
5.0 / 5 (0 votes)
Thanks for rating: