Math 14 HW 7.2.2 Find the degrees of freedom and critical t value.
TLDRThe video script demonstrates the process of constructing a 95% confidence interval using the T-distribution for a sample of airport data speeds. It explains calculating the degrees of freedom as the sample size minus one, in this case, 49. It further details finding the critical T-value for a 95% confidence level, involving determining the area to the right of the T-distribution curve (0.025) and using StatCrunch to find the critical value, which is 2.01. The script concludes with a definition of degrees of freedom as the number of sample values that can vary after restrictions are imposed.
Takeaways
- 📊 The script discusses constructing a confidence interval using the T-distribution for airport data speeds.
- 🔢 The number of degrees of freedom is calculated as the sample size minus one, which in this case is 49 for a sample size of 50.
- 📉 The script explains the process of finding the critical T-value for a 95% confidence level.
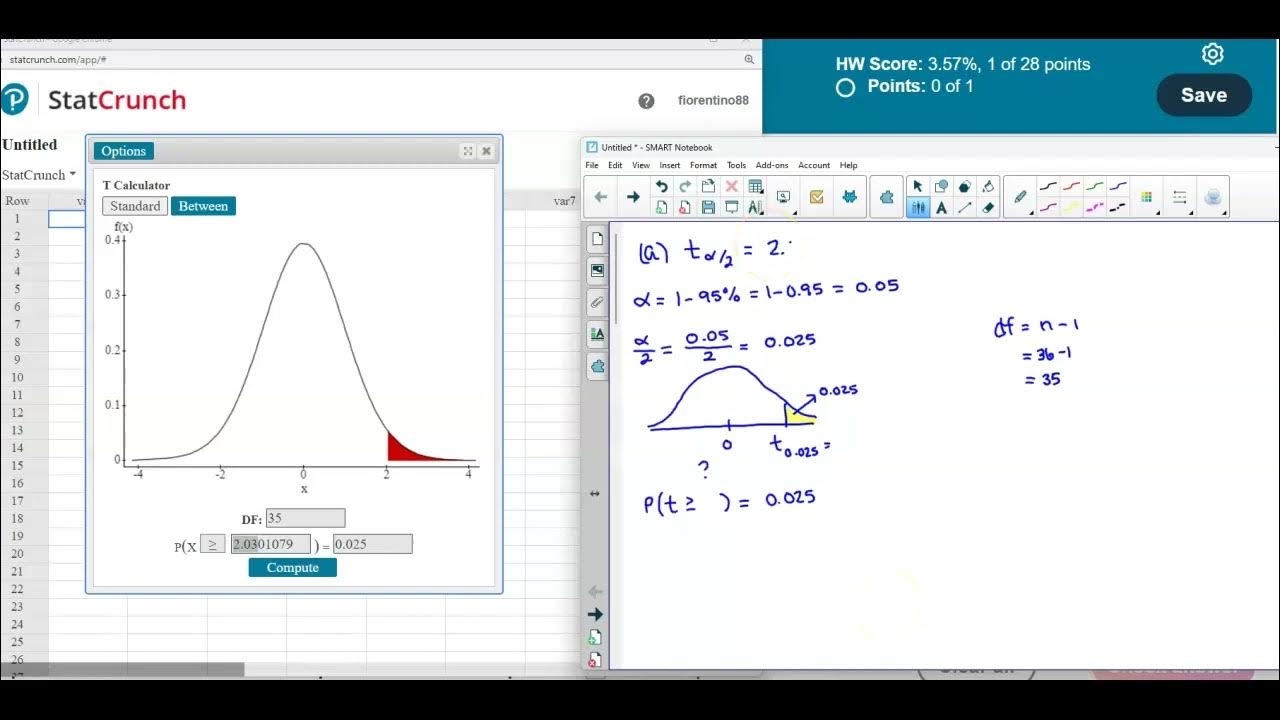
- 🎯 Alpha is determined by subtracting the confidence level from 1, resulting in 0.05, and then dividing by 2 to get 0.025.
- 📍 The area to the right of the T-distribution curve corresponding to the critical T-value is 0.025.
- 🔍 The script instructs to use StatCrunch to find the critical T-value with 49 degrees of freedom and an area to the right of 0.025.
- 📝 The critical T-value is computed to be 2.01 when rounded to two decimal places.
- 📚 A brief description of the number of degrees of freedom is provided, explaining it as the number of sample values that can vary after restrictions.
- 📈 The script uses a visual aid, a data display, to guide through the process of statistical analysis.
- 🤔 The importance of understanding statistical concepts such as degrees of freedom and critical values is highlighted for accurate data interpretation.
- 📝 The script concludes with the results for the question, emphasizing the application of statistical methods in data analysis.
Q & A
What is the number of degrees of freedom used for finding the critical value in a confidence interval based on the T distribution?
-The number of degrees of freedom is the sample size minus one, which in this case is 50 - 1, resulting in 49 degrees of freedom.
How do you calculate the critical T value for a 95% confidence level?
-First, determine alpha by subtracting the confidence level (0.95) from 1, resulting in 0.05. Then, divide alpha by 2 to get 0.025, which represents the area to the right of the T distribution curve. Use a T distribution table or calculator to find the critical value corresponding to this area with 49 degrees of freedom.
What is the critical T value for a 95% confidence interval with 49 degrees of freedom?
-Using a statistical tool like StatCrunch, input 49 degrees of freedom and an area of 0.025 to find the critical T value, which is approximately 2.01 when rounded to two decimal places.
What is the significance of the area to the right of the T distribution curve in determining the critical T value?
-The area to the right of the T distribution curve, in this case, 0.025, represents the tail end of the distribution where the critical T value lies. It is used to find the value that corresponds to the desired confidence level.
What is the formula for calculating the degrees of freedom in a sample?
-The formula for calculating the degrees of freedom in a sample is simply the sample size (n) minus 1 (n - 1).
What is the role of the sample size in determining the degrees of freedom?
-The sample size directly influences the degrees of freedom, as it is the basis for the calculation (sample size minus one).
Why is it necessary to find the critical T value for constructing a confidence interval?
-The critical T value is necessary to construct a confidence interval because it helps define the range within which the true population parameter is likely to fall with a certain level of confidence.
How does the confidence level affect the calculation of the critical T value?
-The confidence level determines the area in the tail(s) of the T distribution that is used to find the critical T value. A higher confidence level will result in a larger area in the tails and thus a larger critical T value.
What is the relationship between the critical T value and the confidence interval?
-The critical T value, in conjunction with the sample mean and standard deviation, is used to calculate the margin of error for the confidence interval, which then defines the upper and lower bounds of the interval.
Can you provide a brief general description of the number of degrees of freedom?
-The number of degrees of freedom for a collection of sample data is the number of sample values that can vary independently after accounting for any constraints or restrictions imposed on the data set.
Outlines
📊 Calculating Degrees of Freedom and Critical T Value
This paragraph discusses the process of constructing a confidence interval using the T-distribution. It explains that the degrees of freedom is calculated by subtracting one from the sample size, which in this case is 50, resulting in 49 degrees of freedom. The paragraph also details the steps to find the critical T value for a 95% confidence level, which involves calculating the area in the tail of the T-distribution curve that corresponds to the remaining 5% (0.025 in decimal form). The critical T value is then determined using a statistical tool like StatCrunch, where the degrees of freedom and the tail area are input to find the value, rounded to two decimal places, which is 2.01 in this instance.
Mindmap
Keywords
💡Degrees of Freedom
💡Confidence Interval
💡Sample Mean
💡Sample Standard Deviation
💡Sample Size
💡Critical T Value
💡Alpha (α)
💡StatCrunch
💡T-Distribution
💡Area to the Right
Highlights
The number of degrees of freedom for constructing a confidence interval using the T distribution is the sample size minus one.
The formula for degrees of freedom is n - 1.
For a sample size of 50, the degrees of freedom is 49.
To find the critical T value for a 95% confidence level, calculate alpha as 1 - 0.95.
Divide alpha by 2 to get the area to the right of the T distribution curve.
The area to the right of the critical T value is 0.025.
Use StatCrunch to find the critical T value for a given area to the right.
Enter the degrees of freedom (49) and the area to the right (0.025) in StatCrunch.
The critical T value for a 95% confidence level with 49 degrees of freedom is 2.01.
The number of degrees of freedom represents the number of sample values that can vary after restrictions.
The degrees of freedom is essential for constructing confidence intervals using the T distribution.
Alpha represents the significance level, which is used to find the critical T value.
The critical T value is rounded to two decimal places for practical use.
StatCrunch is a useful tool for calculating the critical T value.
The critical T value helps determine the margin of error in a confidence interval.
Understanding the concept of degrees of freedom is crucial for statistical analysis.
The sample standard deviation and size are key components in calculating the critical T value.
The confidence interval provides an estimate of the population parameter with a certain level of certainty.
Transcripts
Browse More Related Video
How To...Calculate the Confidence Interval for a Sample

Student's T Distribution - Confidence Intervals & Margin of Error

Elementary Statistics - Chapter 7 - Estimating Parameters and Determining Sample Sizes Part 2

Confidence Interval for a population mean - t distribution
Math 14 HW 7.2.5-T Find critical t value, margin of error & confidence interval for population mean.
How to calculate t distributions
5.0 / 5 (0 votes)
Thanks for rating: