t-distribution in Statistics and Probability | Statistics Tutorial #9 | MarinStatsLectures
TLDRThe t-distribution, also known as Student's t-distribution, is a statistical concept that addresses the uncertainty in estimating the population standard deviation from a sample. Developed by William Gossett while working at Guinness breweries, it is particularly useful for small sample sizes where the normal distribution may underestimate the true variability. The t-distribution is similar to the standard normal distribution but is wider, accounting for the additional uncertainty. As sample size increases, the t-distribution converges towards the standard normal distribution. It's important to note that while a sample size of infinity is impractical, sample sizes above 120 make the two distributions approximately the same, and by 200, there's almost no difference. The t-distribution is often used in conjunction with software for precise calculations.
Takeaways
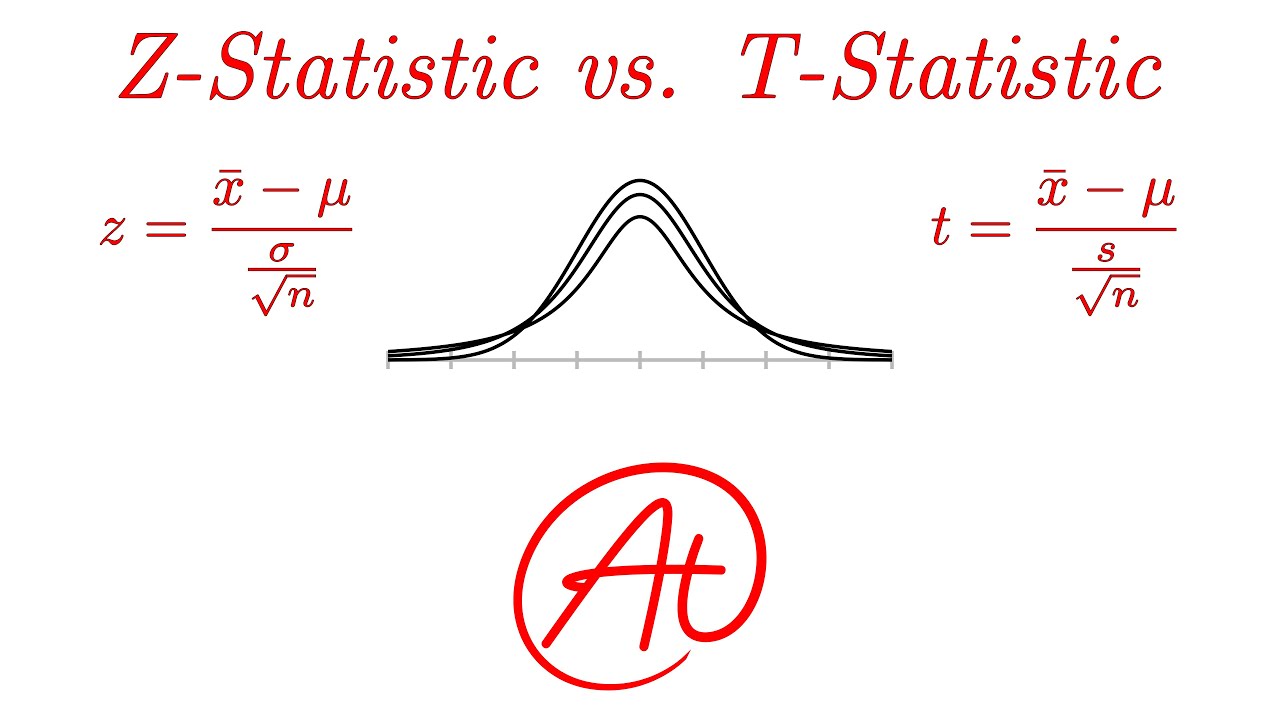
- 📊 The t-distribution is similar to the standard normal distribution (Z-distribution) but is used for samples of data where the population standard deviation is unknown.
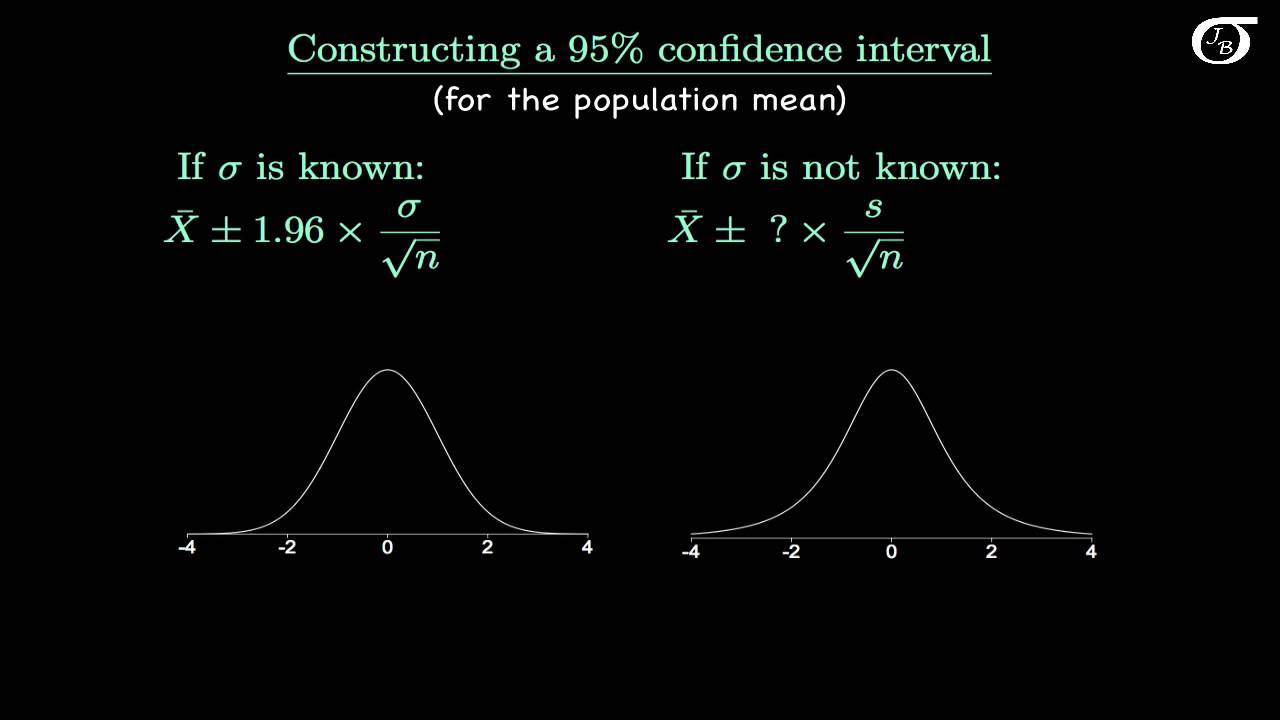
- 🔍 We use the t-distribution instead of the Z-distribution when estimating the standard error because we use the sample standard deviation in place of the true population standard deviation.
- 🌟 William Gossett developed the t-distribution while working on quality control at Guinness breweries, noticing discrepancies with small sample sizes in normal distribution calculations.
- 🏢 The distribution was published under the name 'Student' due to Gossett's employer, Guinness, requiring anonymity, hence it's often called Student's t-distribution.
- 📈 As sample size increases, the t-distribution converges towards the standard normal distribution, becoming virtually identical for large sample sizes.
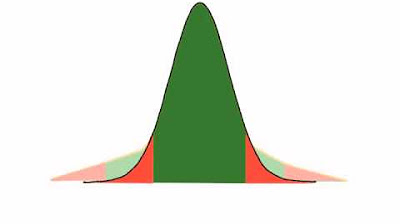
- 🔢 The t-distribution accounts for additional uncertainty due to the estimation of the standard deviation from sample data, which is why it is slightly wider than the normal distribution.
- 🛠️ When working with the t-distribution, software is typically used for exact calculations, which is why the script author prefers explaining concepts using the Z-distribution for educational purposes.
- 🎓 Focusing on finding values from a t-table can distract students from understanding the broader concepts of statistical analysis.
- 📝 The t-distribution is particularly useful for small sample sizes, where the estimate of the standard deviation is less reliable.
- 📈 A t-distribution with a large number of degrees of freedom (e.g., infinity) effectively becomes the standard normal distribution.
- 📚 For practical purposes, a sample size greater than 120 makes the t-distribution approximately the same as the standard normal distribution, and by 200, there's almost no difference.
Q & A
What is the t-distribution?
-The t-distribution, also known as Student's t-distribution, is a family of distributions that are similar to the normal distribution but account for the additional uncertainty that arises when estimating the standard deviation from a sample instead of the population.
Why do we use the t-distribution instead of the standard normal distribution (Z)?
-We use the t-distribution instead of the standard normal distribution when we do not know the true population standard deviation and have to estimate it using the sample standard deviation. This is common in situations where we have small sample sizes and the sample standard deviation is not a perfect estimate of the population standard deviation.
Who developed the t-distribution and in what context?
-The t-distribution was developed by William Gossett while working on quality control at Guinness Breweries. He noticed discrepancies when using the normal distribution for small sample sizes and realized the need for a distribution that could account for the estimation of the standard deviation.
Why is it called Student's t-distribution?
-It is called Student's t-distribution because William Gossett published his work under the pseudonym 'Student' due to the proprietary nature of his work for Guinness Brewery.
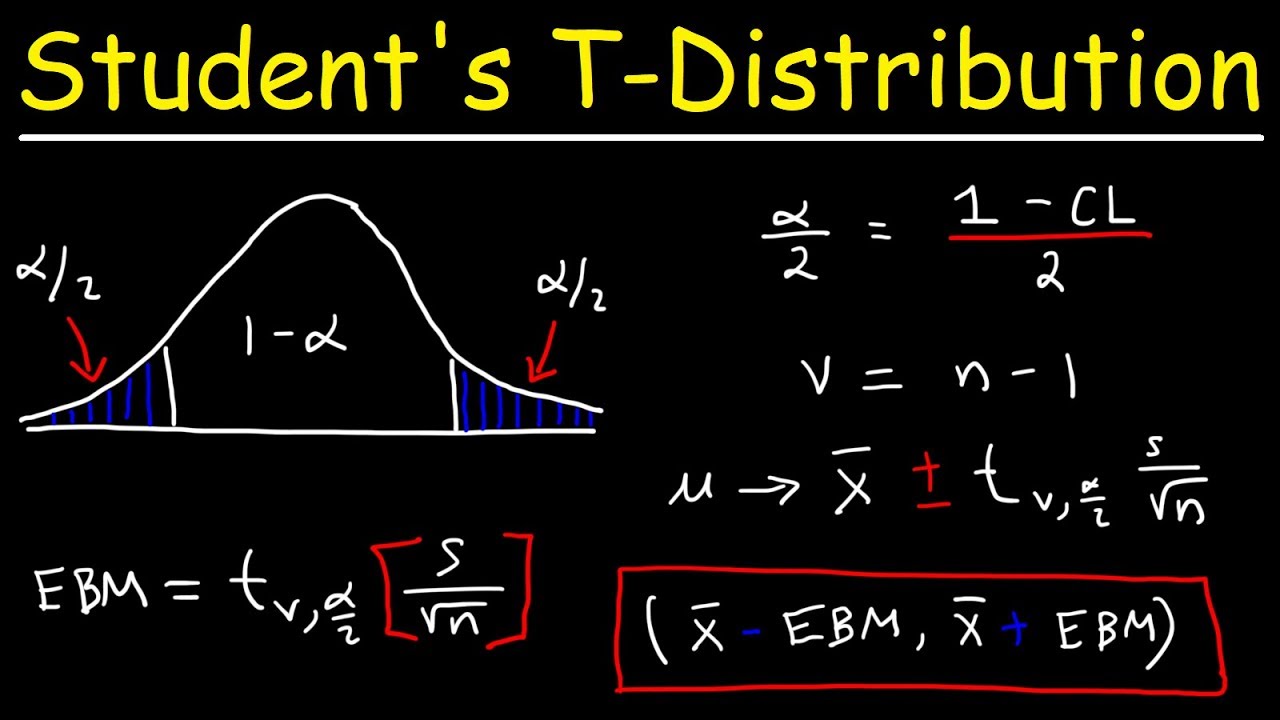
How does the t-distribution differ from the standard normal distribution visually?
-Visually, the t-distribution looks similar to the standard normal distribution but is slightly wider, especially with smaller degrees of freedom. This wider shape accounts for the extra uncertainty in estimating the standard deviation from a sample.
What happens to the t-distribution as the sample size increases?
-As the sample size increases, the t-distribution converges towards the standard normal distribution. Specifically, when the degrees of freedom approach infinity, the t-distribution becomes the standard normal distribution.
At what sample size does the t-distribution approximately equal the standard normal distribution?
-Once the sample size is larger than 120, the t-distribution and the standard normal distribution become approximately the same. With a sample size bigger than 200, there is almost no difference between the two distributions.
Why might one choose to use the Z distribution over the T distribution when explaining concepts?
-Using the Z distribution can simplify the explanation of concepts by focusing on the key ideas without getting students bogged down with the details of finding values from a t-table, which can sometimes distract from the larger concepts being discussed.
How are calculations involving the t-distribution typically performed?
-Calculations involving the t-distribution are generally performed using software, which can handle the complexities of finding exact values based on the degrees of freedom and the desired confidence level.
What is the standard error of the mean, and why is it important?
-The standard error of the mean is a measure of how much the sample mean is expected to vary from the true population mean. It is important because it helps in estimating the precision of the sample mean and is used in constructing confidence intervals and conducting hypothesis tests.
How does the concept of degrees of freedom relate to the t-distribution?
-The degrees of freedom in the context of the t-distribution refer to the number of independent observations in the sample from which the t-statistic is calculated. It affects the shape of the t-distribution, with lower degrees of freedom resulting in a wider distribution and higher degrees of freedom making the t-distribution more similar to the standard normal distribution.
Outlines
📊 Introduction to the T-Distribution
This paragraph introduces the concept of the T-distribution, explaining its purpose and relation to the standard normal distribution (Zed). It emphasizes that the T-distribution is used when the true population standard deviation is unknown, necessitating the use of the sample standard deviation to estimate the standard error of the mean. The origin of the T-distribution is attributed to William Gossett, who worked at Guinness breweries and developed it due to the inaccuracies he found with small sample sizes using the normal distribution. The paragraph also explains how the T-distribution resembles the normal distribution but is wider to account for the additional uncertainty, and how it converges to the normal distribution as sample size increases.
Mindmap
Keywords
💡t-distribution
💡standard normal distribution
💡sample standard deviation
💡standard error
💡William Gossett
💡degrees of freedom
💡sample size
💡quality control
💡statistical estimation
💡normal distribution
💡Student's t-distribution
Highlights
The t-distribution is akin to the standard normal distribution (Zed) for samples of data.
We use the t-distribution over Z because we do not know the true population standard deviation.
The t-distribution allows us to use the sample standard deviation in place of the population standard deviation for estimating the standard error.
William Gossett developed the t-distribution while working on quality control at Guinness breweries.
Gossett's work was published under the pseudonym 'Student', hence the name 'Student's t-distribution'.
The t-distribution accounts for the additional uncertainty from estimating the standard deviation using sample data.
As sample size increases, the t-distribution converges towards the standard normal distribution.
With a larger sample size (above 120), the t-distribution and standard normal become approximately the same.
A sample size of over 200 makes the difference between the t-distribution and standard normal almost negligible.
The t-distribution is wider than the normal distribution to accommodate the extra uncertainty in sample standard deviation estimates.
The t-distribution is particularly useful for small sample sizes in quality control and statistical analysis.
In practice, software is typically used for exact calculations involving the t-distribution.
The concept of the t-distribution helps in understanding the normal distribution for a sample of data.
Focusing on the t-distribution can sometimes distract from the broader statistical concepts being discussed.
The t-distribution's practical applications were initially recognized in the context of quality control at Guinness breweries.
The t-distribution's development and adoption in statistical analysis highlight the importance of adapting to sample size limitations.
Transcripts
Browse More Related Video
How to calculate t distributions
Z-statistics vs. T-statistics | Inferential statistics | Probability and Statistics | Khan Academy
Introduction to the t Distribution (non-technical)
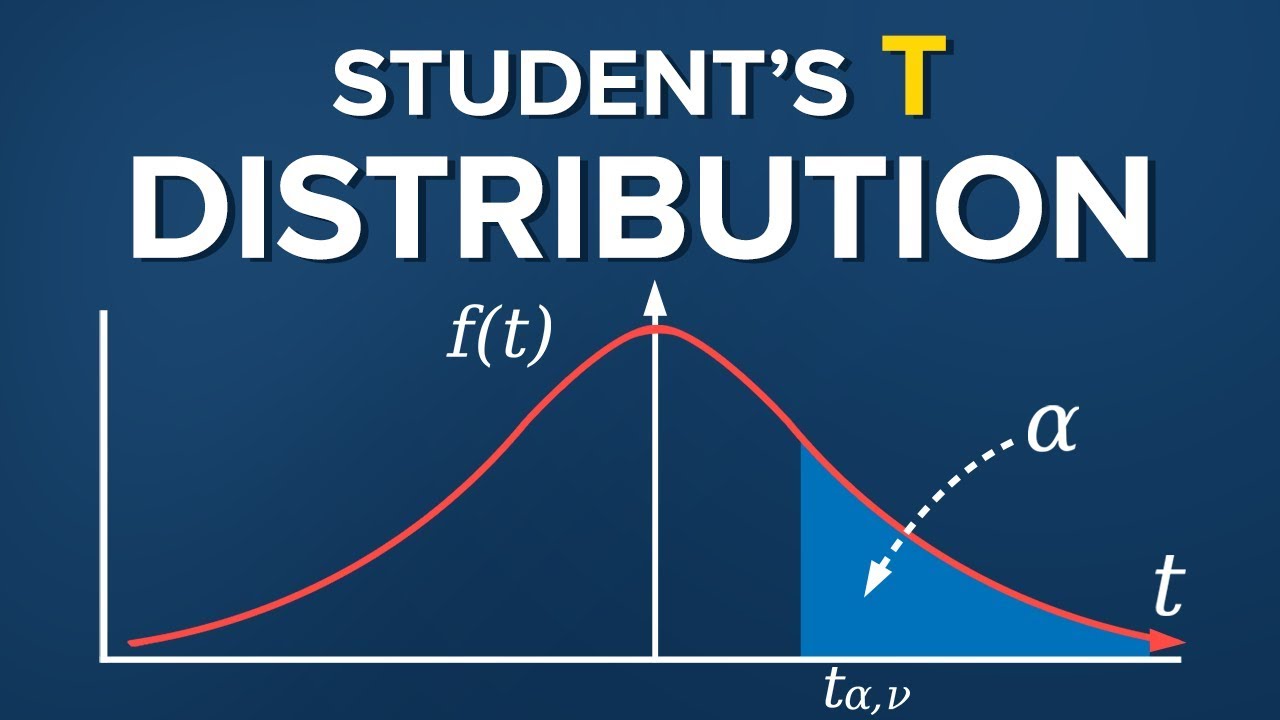
Student's T Distribution
Z-Statistics vs. T-Statistics EXPLAINED in 4 Minutes
Student's T Distribution - Confidence Intervals & Margin of Error
5.0 / 5 (0 votes)
Thanks for rating: