01 - Hypothesis Testing For Means & Large Samples, Part 1
TLDRThis transcript introduces the concept of hypothesis testing with large sample sizes, where the normal distribution is used instead of the T distribution. It explains that as sample size grows, the T distribution increasingly resembles the normal distribution, making it suitable to use the latter for samples greater than 30. The process for hypothesis testing remains the same, but the test statistic changes from T to Z. The video also discusses the significance of the rejection regions and how they can be determined ahead of time with a normal distribution, simplifying the process for common confidence levels.
Takeaways
- 📊 In hypothesis testing, different distributions are used based on sample size. For sample sizes less than 30, the T-distribution is used, while for sample sizes greater than 30, the normal distribution is applied.
- 🔄 As the sample size increases, the T-distribution more closely resembles the normal distribution, eventually looking like it when a large number of samples is collected.
- 📈 The formula for the test statistic changes with the distribution used. For a large sample size, the Z-score is calculated as (x̄ - μ) / (s / √n), whereas for a small sample size, the T-score was used.
- 🌟 The concept of hypothesis testing remains the same regardless of the distribution used. One must still define rejection regions, calculate the test statistic, and then determine whether to reject or fail to reject the null hypothesis.
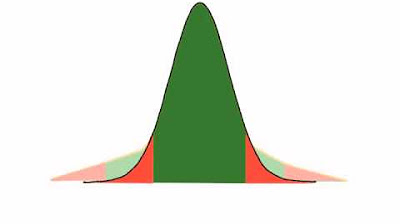
- 📝 The normal distribution's shape is constant and does not change with different sample sizes, simplifying the process of finding rejection regions compared to the T-distribution.
- 🔢 Common Z-scores for different levels of confidence and types of tests are readily available and can be used without having to calculate them for each individual problem.
- 🔄 For one-tailed tests, the Z-scores are positive, and for two-tailed tests, they are split equally and oppositely (+Z and -Z), representing the two rejection regions on either side of the distribution.
- 📐 The Z-distribution is tabulated for the area to the left of Z, in contrast to the T-distribution which is defined for the area to the right of T. This difference is important when looking up values in statistical tables.
- 🎯 When working with large sample sizes, it's not necessary to calculate rejection regions for each problem; instead, one can refer to standard Z-score tables for common confidence levels.
- 📋 The provided script serves as a guide for understanding the transition from using the T-distribution to the normal distribution in hypothesis testing and the corresponding changes in the test statistic formula.
- 🚀 Moving forward, as sample sizes increase, the process of hypothesis testing becomes more streamlined, with less reliance on the specific characteristics of the T-distribution and more on the stable properties of the normal distribution.
Q & A
What is the main topic of this lesson?
-The main topic of this lesson is hypothesis testing with a focus on large sample sizes, specifically when the sample size is greater than 30.
What is the significance of the sample size being 30 or less in hypothesis testing?
-When the sample size is 30 or less, we use the T-distribution for hypothesis testing. As the sample size increases beyond 30, the T-distribution approaches the normal distribution, and we can use the normal distribution for hypothesis testing.
What are the two types of distributions discussed in the transcript?
-The two types of distributions discussed are the T-distribution and the normal distribution. The T-distribution is used for small sample sizes (less than 30), while the normal distribution is used for large sample sizes (greater than 30).
How does the shape of the T-distribution change with the sample size?
-The shape of the T-distribution is bell-shaped, but it changes depending on the degrees of freedom, which is the number of samples minus one. As the sample size increases, the T-distribution more closely resembles the normal distribution.
What is the formula for the test statistic when using the normal distribution?
-The formula for the test statistic when using the normal distribution is Z = (x̄ - μ) / (s / √n), where x̄ is the sample mean, μ is the population mean, s is the sample standard deviation, and n is the sample size.
What are the key steps in hypothesis testing with large samples?
-The key steps in hypothesis testing with large samples are: determining the rejection regions, calculating the test statistic (Z-score), comparing the test statistic to the rejection regions, and making a decision to reject or fail to reject the null hypothesis.
Why do we use different Z-scores for different levels of confidence in a two-tail test?
-We use different Z-scores for different levels of confidence in a two-tail test because each confidence level corresponds to a specific area under the standard normal curve. The Z-scores represent the points that divide the curve into the desired areas, with the rejection regions being the tails on either side of these points.
What is the Z-score for a one-tail test with a 90% confidence level?
-The Z-score for a one-tail test with a 90% confidence level is 1.28. This value corresponds to an area of 0.10 to the right of the Z-score in the standard normal distribution.
How do you determine whether a hypothesis test is a one-tail or two-tail test?
-You determine whether a hypothesis test is a one-tail or two-tail test based on the research question and the alternative hypothesis. If the alternative hypothesis suggests that the population parameter is either less than or greater than the null hypothesis value, it's a two-tail test. If it suggests that the population parameter is either less than or equal to, or greater than or equal to the null hypothesis value, it's a one-tail test.
What is the significance of the normal distribution's shape being constant?
-The significance of the normal distribution's shape being constant is that it simplifies hypothesis testing with large samples. Since the shape does not change with different sample sizes, the critical Z-scores for different levels of confidence and types of tests remain the same, making it easier to apply the same rules across various problems.
How does the use of a normal distribution affect the process of hypothesis testing with large samples?
-The use of a normal distribution affects the process of hypothesis testing with large samples by eliminating the need to adjust for different sample sizes. Once the sample size exceeds 30, the T-distribution becomes very similar to the normal distribution, and we can use standard Z-tables to find critical values for hypothesis testing. This makes the process more straightforward and less dependent on the specific sample size or degrees of freedom.
Outlines
📚 Introduction to Hypothesis Testing with Large Samples
This paragraph introduces the concept of hypothesis testing with a focus on large sample sizes, defined as greater than 30 samples. It contrasts this with small sample hypothesis testing, which was previously discussed. The speaker explains that with large samples, the T-distribution, which was used for small samples, is replaced by the normal distribution. The reason for this switch is that as the sample size increases, the T-distribution increasingly resembles the normal distribution. The paragraph emphasizes that despite the change in distribution, the methodology of hypothesis testing remains the same: defining rejection regions, calculating a test statistic, and making decisions based on where the test statistic falls.
📈 Understanding the Normal Distribution in Hypothesis Testing
In this paragraph, the speaker delves deeper into the use of the normal distribution for hypothesis testing with large samples. It explains that unlike the T-distribution, which changes shape based on the degrees of freedom (sample size), the normal distribution maintains a constant shape regardless of the sample size. This consistency simplifies the process, as the rejection regions do not need to be recalculated for each problem. The speaker provides a table of common Z-values associated with different confidence levels and types of tests (one-tailed or two-tailed), which can be used directly from the normal distribution without alteration. This standardization is highlighted as a key advantage when working with large sample sizes in hypothesis testing.
🔄 Z-Value Calculations for Different Types of Tests
The speaker concludes the lesson by discussing the specifics of Z-value calculations for different types of hypothesis tests. It clarifies how to determine the appropriate Z-values for one-tailed and two-tailed tests at various confidence levels. The paragraph emphasizes that for one-tailed tests, the rejection region will be either to the right or left of the distribution, depending on the direction of the test, and the Z-value will be positive or negative accordingly. For two-tailed tests, the rejection regions are symmetrical around the mean, with Z-values being equal and opposite in sign. The speaker also reminds learners to be mindful of the direction (left or right) when applying the Z-values, as this affects the interpretation of the test results.
Mindmap
Keywords
💡Hypothesis Testing
💡Sample Size
💡T Distribution
💡Normal Distribution
💡Degrees of Freedom
💡Test Statistic
💡Rejection Region
💡Level of Significance (Alpha)
💡Confidence Interval
💡One-Tailed and Two-Tailed Tests
💡Z-Score (Z Value)
Highlights
The lesson focuses on hypothesis testing with large samples, which is a shift from previous lessons that covered small sample sizes.
The sample size threshold for using the normal distribution instead of the T distribution is 30 or more samples.
The T distribution becomes more like the normal distribution as the sample size increases.
When the sample size is greater than 30, the hypothesis testing method remains largely the same, but the test statistic changes from T to Z.
The Z distribution is used for large samples because it does not change shape regardless of the sample size.
For large sample sizes, the rejection regions can be predetermined and do not need to be calculated for each problem.
The Z table provides the Z scores that correspond to specific areas in the tails of the distribution, simplifying the hypothesis testing process.
Common confidence levels such as 90%, 95%, 98%, and 99% have established Z scores for one and two-tailed tests, which can be directly applied.
The Z score for a one-tailed test at a 90% confidence level is 1.28, which is the same regardless of sample size.
For a two-tailed test, the Z scores are equal and opposite, allowing for the calculation of rejection regions on both sides of the distribution.
The normal distribution is always tabulated for the area to the left of Z, unlike the T distribution which is for the area to the right of T.
When using the Z distribution, it's important to remember that the Z table provides the area to the left, which differs from the T distribution.
The lesson explains the transition from using the T distribution for small samples to the normal distribution for large samples in hypothesis testing.
The concept of rejection regions and how they are determined remains consistent even when switching from T to Z scores.
The lesson provides a clear understanding of when and why to switch from the T distribution to the normal distribution in hypothesis testing.
The Z scores for common confidence levels can be memorized or easily found in a book, streamlining the hypothesis testing process for large samples.
The lesson emphasizes the practical application of Z scores in hypothesis testing with large sample sizes, making the process more efficient.
Transcripts
Browse More Related Video
How to calculate t distributions
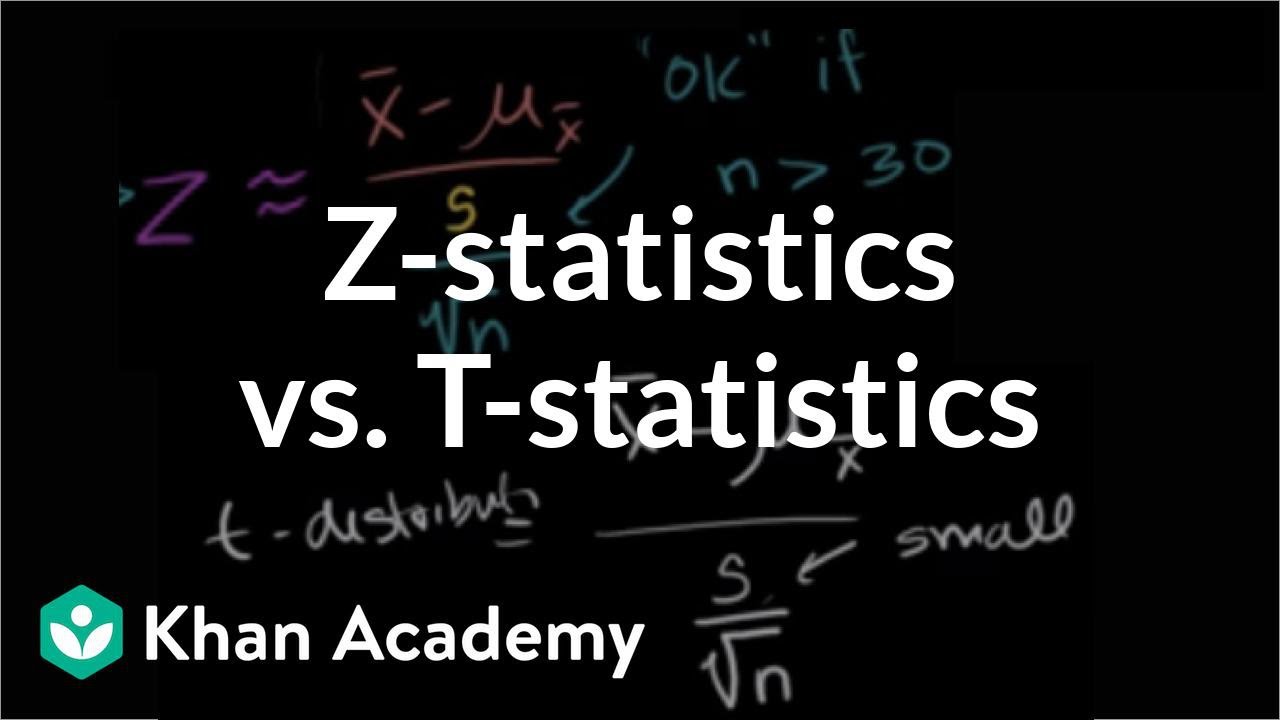
Z-statistics vs. T-statistics | Inferential statistics | Probability and Statistics | Khan Academy
Introduction to the t Distribution (non-technical)
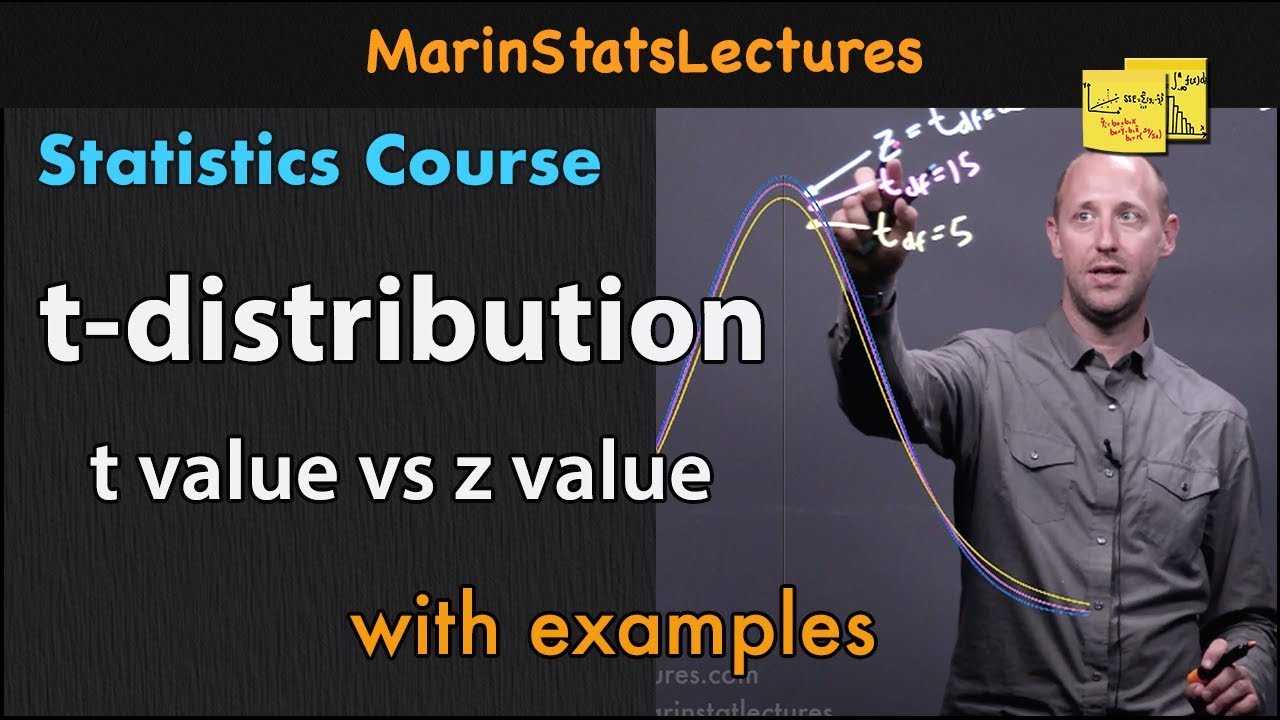
t-distribution in Statistics and Probability | Statistics Tutorial #9 | MarinStatsLectures

Lesson 10 - Rejection Regions In Hypothesis Testing (Statistics Tutor)
Explaining The One-Sample t-Test
5.0 / 5 (0 votes)
Thanks for rating: