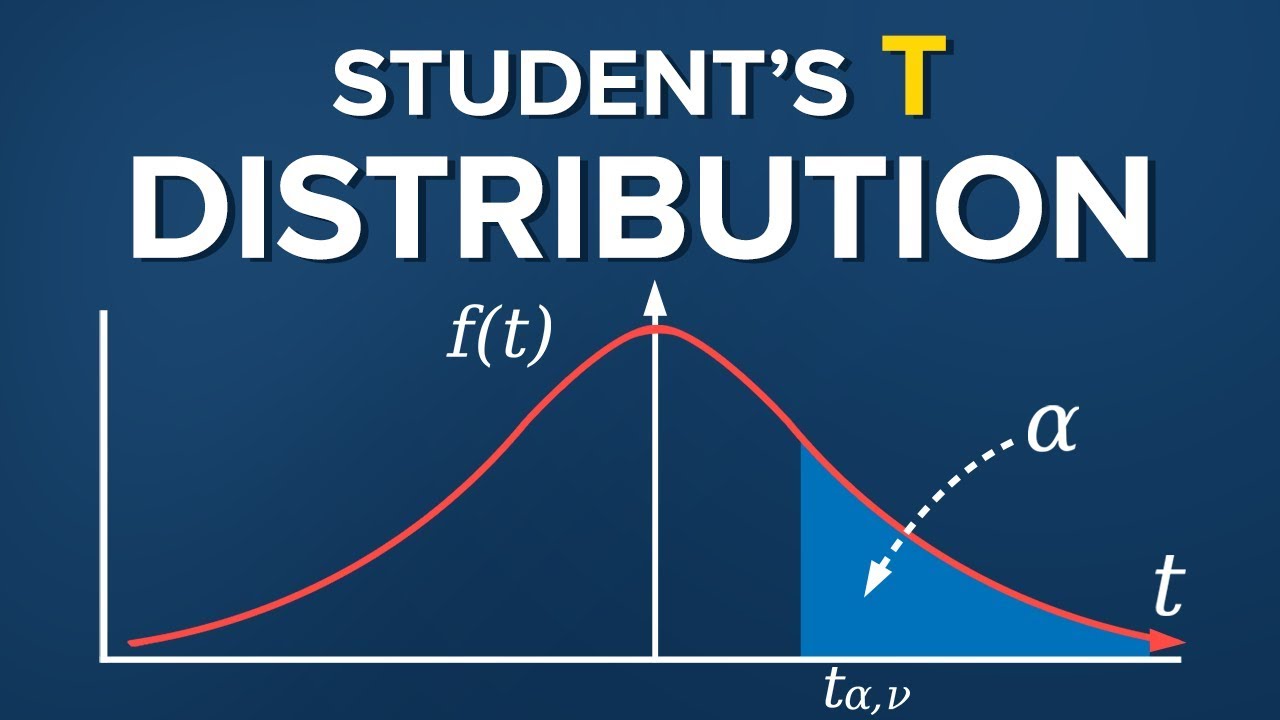
What is the t-distribution? An extensive guide!
TLDRThis video delves into the student's t-distribution, commonly known as the t-distribution, which is pivotal in statistics for small sample analysis. It explains the t-test's origin by William Sealy Gosset in 1908, addressing the challenge of estimating population parameters without the population standard deviation. The script offers an overview of the t-distribution's purpose, its relation to the normal distribution, and how it adapts with varying degrees of freedom. It also covers how to calculate t-distribution probabilities using Excel functions and traditional t-tables, providing a comprehensive guide for statistical practice.
Takeaways
- 📚 The student's t-distribution, also known as the t-distribution, is a statistical distribution used for small sample sizes and is often misunderstood.
- 👤 The t-test was developed by William Sealy Gosset in 1908 while working for Guinness, who used the pseudonym 'Student', hence the name 'Student's t-distribution'.
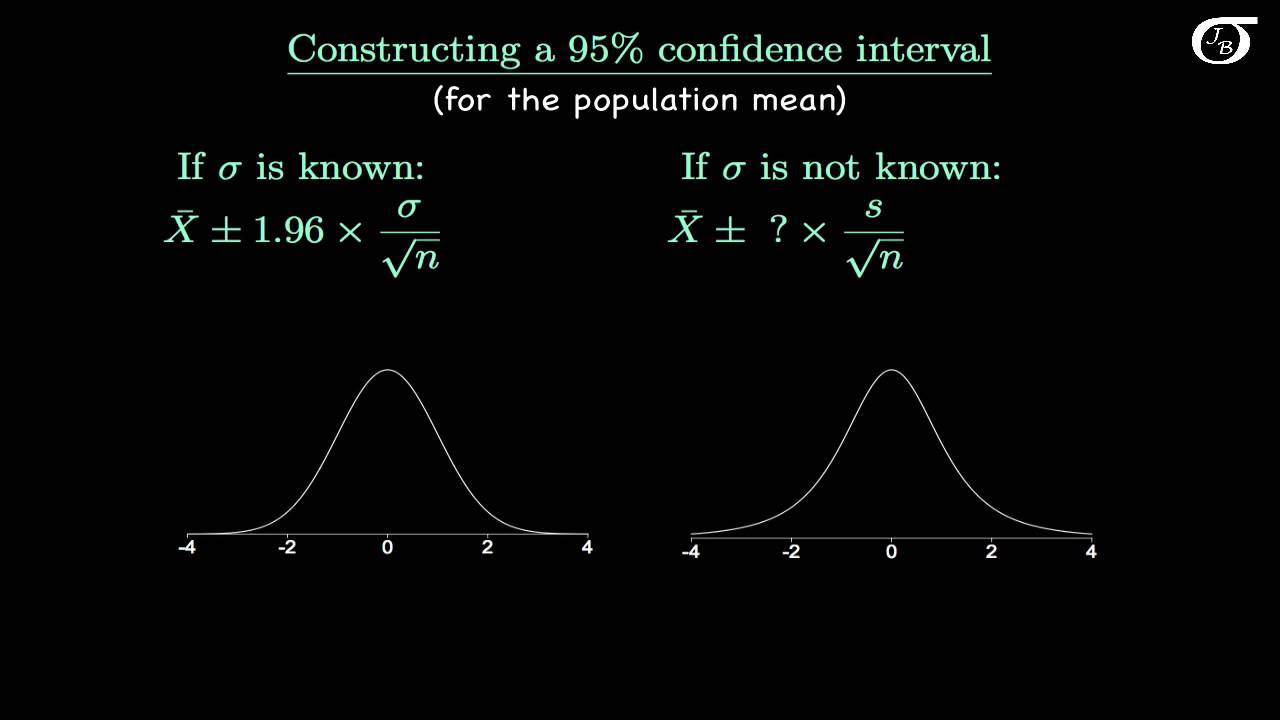
- 📉 The t-distribution is used when the underlying population distribution is normal, the population standard deviation is unknown, and the sample size is too small for the central limit theorem to apply.
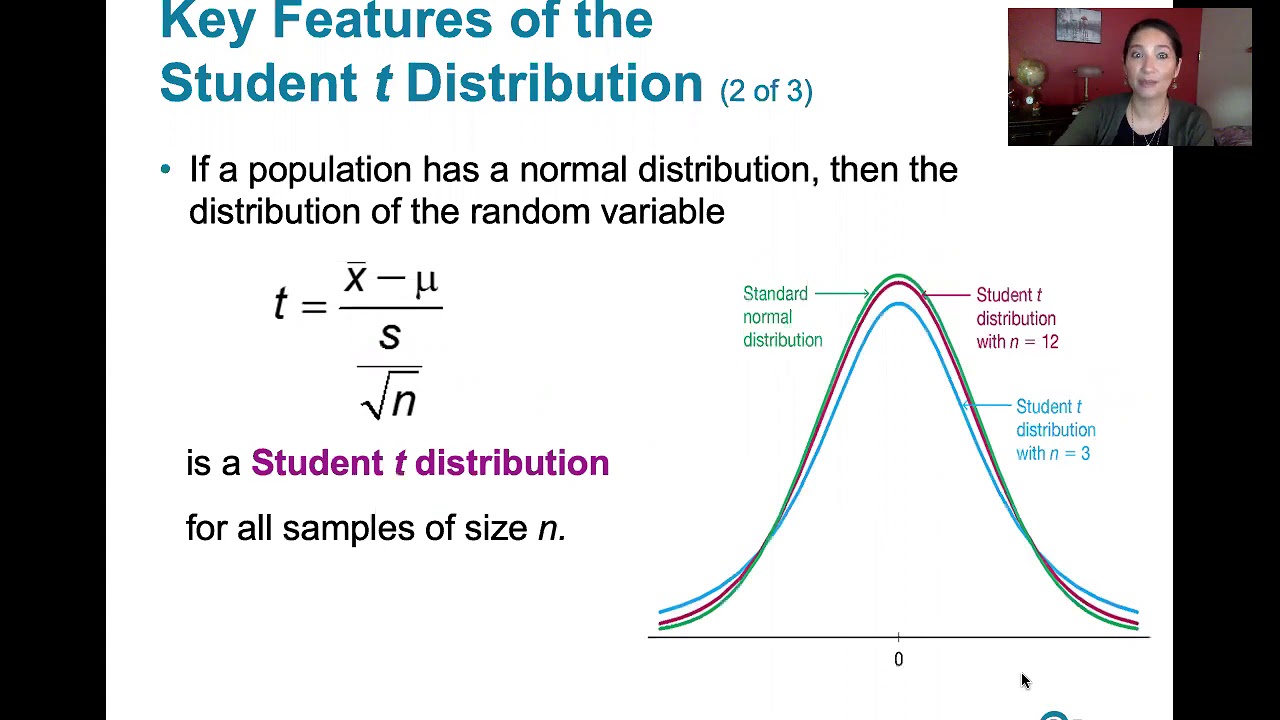
- 📊 The t-distribution is characterized by having fatter tails and being less peaked than the normal distribution, which accounts for the additional uncertainty in estimating the population standard deviation from a small sample.
- 🔢 The t-distribution's shape changes with the degrees of freedom, which depends on the sample size. As the sample size increases, the t-distribution approaches the normal distribution.
- 📘 The t-distribution is used in various statistical tests such as the one-sample t-test, regression analysis, and the two-sample t-test.
- 📝 The script explains the concept of degrees of freedom in the context of the t-distribution, which is essentially the sample size minus one.
- 📉 Visual comparisons in the script show how the t-distribution varies with different degrees of freedom, highlighting its flatter shape with fewer degrees of freedom.
- 🧮 The script discusses how to calculate the probability distribution function (PDF) and the cumulative distribution function (CDF) for the t-distribution, using Excel functions and traditional t-tables.
- 🔍 Excel functions such as T.DIST, T.DIST.2T, and T.INV are explained for calculating different aspects of the t-distribution, including the PDF and CDF.
- 📚 The use of t-tables for finding critical values of the t-distribution is demonstrated, showing how to read values for specific degrees of freedom and significance levels.
Q & A
What is the t-distribution also known as?
-The t-distribution is also known simply as the 'Student's t-distribution'.
Why was the t-test developed?
-The t-test was developed to deal with the problem of small sample sizes in statistics, particularly when the population standard deviation was unknown.
Who is credited with the development of the t-test?
-William Sealy Gosset, who worked under the pseudonym 'Student', is credited with the development of the t-test.
What was the pseudonym used by William Sealy Gosset and why?
-Gosset used the pseudonym 'Student' because his employer, Guinness, did not want to reveal that they were using a statistician, which could give their competitors an advantage.
What is the purpose of the t-test and t-distribution in statistical practice?
-The purpose of the t-test and t-distribution is to provide a method for dealing with small samples when the population standard deviation is unknown.
How does the t-distribution differ from the normal distribution?
-The t-distribution has fatter tails and is less peaked at the top compared to the normal distribution, which accounts for the additional uncertainty in estimating the standard deviation from a small sample.
What is the relationship between the sample size and the t-distribution?
-As the sample size increases, the t-distribution approaches the normal distribution. The t-distribution is more spread out with smaller sample sizes due to the increased uncertainty in estimating the standard deviation.
What are the degrees of freedom in the context of the t-distribution?
-The degrees of freedom in the t-distribution depend on the number of observations in the sample and represent the additional uncertainty in the estimate of the standard deviation.
How can one calculate the probability distribution function (PDF) of the t-distribution?
-The PDF of the t-distribution can be calculated using statistical software or Excel functions like T.DIST, which do not require manual computation of the complex formula involving gamma functions.
What is the cumulative distribution function (CDF) of the t-distribution and how is it used?
-The CDF of the t-distribution represents the area to the left of a particular point on the distribution, indicating the proportion of the distribution up to that point. It can be calculated using Excel functions like T.DIST with the 'TRUE' parameter.
How can one find the T statistic that corresponds to a specific percentile in the t-distribution?
-The T statistic for a specific percentile can be found using the T.INV function in Excel, which requires the desired CDF value and the degrees of freedom as inputs.
What is the significance of the T statistic in hypothesis testing?
-The T statistic is used to determine how extreme a sample statistic is, which can help in deciding whether to reject the null hypothesis in a hypothesis test.
How can one find the T statistic for a 95% confidence interval using a t-table?
-In a t-table, one can find the T statistic for a 95% confidence interval by locating the row corresponding to the desired degrees of freedom and the column for the 2.5% level of significance in each tail (since 2.5% + 95% + 2.5% = 100%).
Outlines
📊 Introduction to Student's T-Distribution
The video begins with an introduction to the Student's T-Distribution, emphasizing its importance in statistics, particularly for dealing with small sample sizes. The speaker outlines the structure of the video, which will cover an overview of the T-Distribution, a comparison with the normal distribution, and practical applications using Excel and traditional T tables.
🍺 William Gosset and the Origins of the T-Test
This section delves into the history of the T-Test, developed by William Sealy Gosset in 1908. Working at Guinness, Gosset was required to publish under the pseudonym 'Student' to prevent competitors from benefiting from statistical insights. The T-Test addresses issues arising from small sample sizes when the population standard deviation is unknown.
📏 Sampling and Distribution Concepts
A detailed explanation of sampling concepts is provided, using the example of female basketball players' heights. The discussion highlights how sample means are distributed, the implications of known and unknown population standard deviations, and introduces the need for the T-Distribution when sample sizes are small.
📈 Understanding the T-Distribution
The speaker explains the T-Distribution's necessity due to additional uncertainty in estimating the sample standard deviation. Visual comparisons of the T-Distribution with varying degrees of freedom against the standard normal distribution are shown, illustrating how the T-Distribution changes with sample size.
🧮 Calculating with T-Distributions
This section covers practical calculations using the T-Distribution. It introduces Excel functions like T.DIST and T.INV for calculating probability and cumulative distribution functions. The video also demonstrates using T tables to find critical values, ensuring viewers understand both modern and traditional methods.
📚 Conclusion and Additional Resources
The video concludes by summarizing the importance of the T-Distribution in statistics and encourages viewers to subscribe for more content. The speaker provides additional resources on their website for further learning and exploration of statistical distributions.
Mindmap
Keywords
💡Student's t-distribution
💡t-test
💡Degrees of freedom
💡Normal distribution
💡Sample mean
💡Population standard deviation
💡Sample standard deviation
💡Central limit theorem
💡Cumulative distribution function (CDF)
💡Excel functions
💡T-tables
Highlights
Introduction to the t-distribution, also known as Student's t-distribution.
Comparison of t-distribution with other distributions like Poisson, binomial, and normal.
Explanation of the purpose and application of the t-test, specifically for small sample sizes.
Historical background on William Sealy Gosset, the creator of the t-test, and his work with Guinness.
Description of the problem solved by the t-distribution: dealing with small samples when the population standard deviation is unknown.
Overview of the central limit theorem and its limitations with small sample sizes.
Introduction to different types of t-tests: one-sample t-test, regression, and two-sample t-test.
Discussion on how the t-distribution adjusts for additional uncertainty in the sample standard deviation.
Visual comparison of the t-distribution and the standard normal distribution with varying degrees of freedom.
Explanation of how the shape of the t-distribution changes with different degrees of freedom.
Overview of the probability distribution function (PDF) and cumulative distribution function (CDF) for the t-distribution.
Practical examples using Excel functions to calculate values related to the t-distribution.
Step-by-step process to find the proportion of a t-distribution above a certain value using Excel.
Guidance on how to use t-tables to find critical values for t-tests, relevant for university students.
Final remarks on the importance and widespread use of the t-distribution in statistical analysis.
Transcripts
Browse More Related Video
Introduction to the t Distribution (non-technical)
7.2.1 Estimating a Population Mean - Student t Distribution and Finding Critical t Values
Student's T Distribution
t-distribution in Statistics and Probability | Statistics Tutorial #9 | MarinStatsLectures
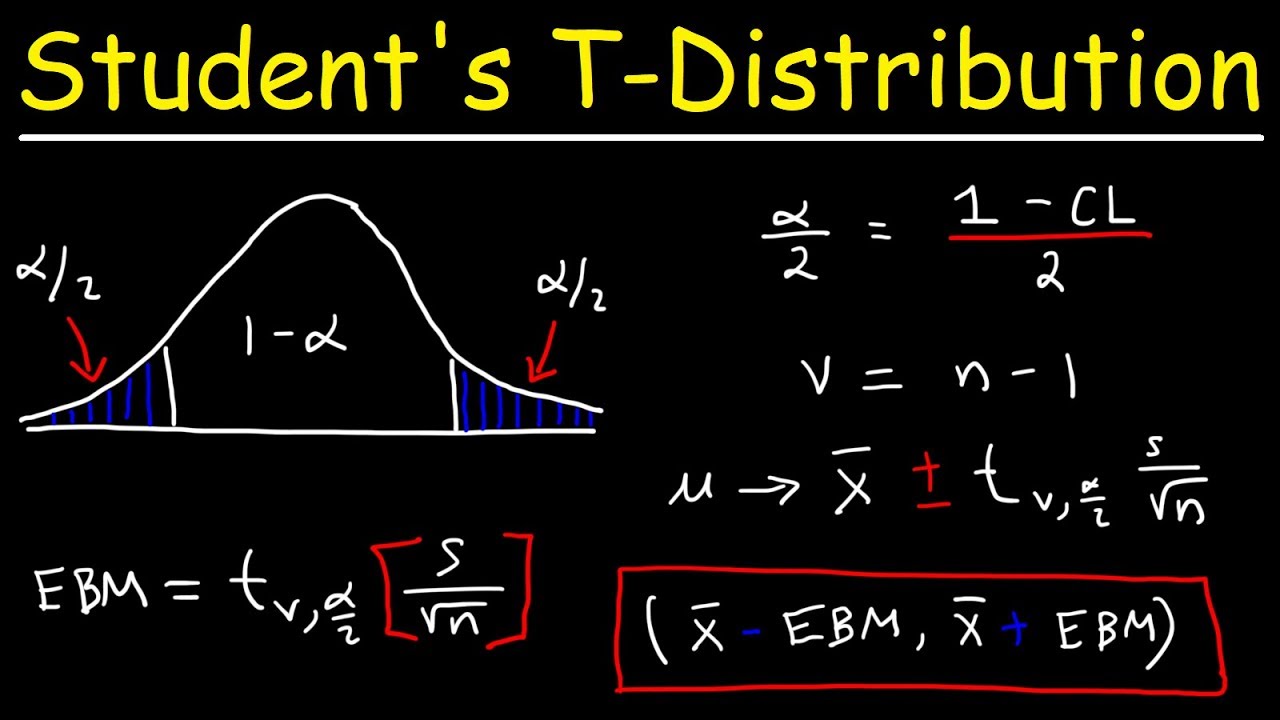
Student's T Distribution - Confidence Intervals & Margin of Error
Z-statistics vs. T-statistics | Inferential statistics | Probability and Statistics | Khan Academy
5.0 / 5 (0 votes)
Thanks for rating: