Linear Regression in R, Step-by-Step
TLDRThis video script introduces viewers to performing linear regression in R, using a mouse weight and size dataset. It guides through data plotting, model fitting with the LM function, and interpreting outputs such as residuals, least squares estimates, and R-squared values. The focus is on assessing the statistical significance of the weight variable for predicting mouse size, aiming for a p-value less than 0.05 for reliability. The script concludes by demonstrating how to add the regression line to a graph, emphasizing the explanatory power of weight in size variation.
Takeaways
- 📊 The video is a tutorial on performing linear regression in R, intended as a companion to Stat Quest's linear regression content.
- 🧬 The video is presented by the genetics department at the University of North Carolina at Chapel Hill.
- 💾 It is assumed that viewers can import data into R; the focus is on using and interpreting linear regression models.
- 📈 The demonstration uses a data frame with 'weight' and 'size' columns to illustrate the process.
- 📊 The 'plot' function in R is used to visualize data on an XY graph before performing linear regression.
- 🔢 Linear models in R are specified using the 'LM' function, with a formula to define the relationship between variables.
- 📝 The 'summary' function is crucial for interpreting the output of a linear regression model, providing detailed statistics.
- 🎯 The residuals are the distances from the data points to the fitted line, ideally symmetrically distributed around the line.
- 🔍 The least squares estimates for the intercept and slope are provided, with their standard errors and T-values.
- ✅ A significant P-value for the weight parameter indicates it is a reliable predictor for size in the model.
- 📊 R-squared and adjusted R-squared values are used to assess the model's explanatory power and fit, with a significant F-value confirming the model's reliability.
Q & A
What is the main topic of the Stack West video?
-The main topic of the Stack West video is doing linear regression in R, with a focus on how to input data, create a linear regression model, and interpret the results.
Who is presenting the Stack West video?
-The video is presented by the friendly folks in the genetics department at the University of North Carolina at Chapel Hill.
What is the purpose of the Stack West video in relation to Stat Quest?
-The Stack West video is intended to be a companion video for the Stat Quest on linear regression, providing practical guidance on implementing the concepts in R.
How is the data initially presented in the video?
-The data is initially presented in the form of a data frame with two columns: weight and size.
What function is used to create the linear regression model in R?
-The `lm` function, which stands for linear models, is used to create the linear regression model in R.
What does the summary function in R do for a linear regression model?
-The summary function generates various outputs, including the least squares estimates for the intercept and slope, standard errors, T values, P values, and R-squared and adjusted R-squared values.
What do the residuals in a linear regression model represent?
-The residuals represent the distances from the data points to the fitted line. Ideally, they should be symmetrically distributed about the line.
What does a significant P value for the weight in the linear regression model indicate?
-A significant P value for the weight (less than 0.05) indicates that it provides a reliable estimate of mouse size and has statistical significance.
What does the R-squared value in the model signify?
-The R-squared value signifies the proportion of the variance for the dependent variable that's explained by the independent variables in the model. In this case, weight explains 61% of the variation in size.
What is the purpose of the adjusted R-squared value?
-The adjusted R-squared value adjusts the R-squared for the number of parameters in the model, providing a more accurate measure of how well the model fits the data.
How can you add the regression line to the XY graph in R?
-After creating the linear regression model and plotting the data, you can add the regression line to the XY graph to visualize the relationship between the variables.
What should the viewers do if they want to see more similar content?
-If viewers want to see more similar content, they should subscribe to the channel and can also leave their ideas for future content in the comments section.
Outlines
📊 Introduction to Linear Regression in R
This paragraph introduces the topic of linear regression using R, a programming language. It sets the stage for the tutorial by mentioning that the video is a companion to a StatQuest video on linear regression. The speaker assumes viewers have prior knowledge of importing data into R and focuses on guiding them through the process of creating a linear regression model and interpreting its results. The paragraph also briefly touches on the creation of a data frame with two columns, 'weight' and 'size', and how to visualize this data using the 'plot' function in R.
🔍 Setting Up the Linear Regression Model
In this paragraph, the speaker delves into the specifics of setting up the linear regression model using the 'LM' function in R, which stands for linear models. The function is applied with a formula that designates 'size' as the Y values and 'weight' as the X values. The paragraph explains that the 'LM' function calculates the least squares estimates for the y-intercept and the slope, which are crucial components of the linear regression model.
📈 Interpreting the Regression Results
This paragraph is dedicated to explaining how to interpret the output generated by the 'summary' function in R. The speaker walks viewers through understanding the residuals, which are the distances from the data points to the fitted line. The ideal distribution of residuals is symmetrical, with the minimum and maximum values being approximately the same distance from zero. The speaker also discusses the least squares estimates for the fitted line, including the intercept and slope, along with their standard errors and T values. The calculation of P values for these estimates is mentioned, which helps determine the significance of the parameters in the model.
🎯 Evaluating Model Significance and Goodness of Fit
The paragraph discusses the evaluation of the model's significance and goodness of fit. It explains the meaning of the residual standard error, which is the square root of the denominator in the F equation, and the importance of the multiple R-squared and adjusted R-squared values. The speaker clarifies that multiple R-squared indicates the proportion of variance in the dependent variable that is predictable from the independent variable. The adjusted R-squared value is then explained as a scaling of the R-squared by the number of parameters in the model. The significance of the R-squared value, as determined by the F value and its associated p-value, is also highlighted to demonstrate the reliability of the model's estimates.
🖼️ Adding the Regression Line to the Graph
The final paragraph of the script wraps up the tutorial by showing how to add the regression line to the previously created XY graph. This step visually demonstrates the results of the linear regression analysis. The speaker encourages viewers to engage with the content by liking the video and subscribing for more tutorials like this. The paragraph concludes with an invitation for viewers to share ideas for future StatQuest videos in the comments section.
Mindmap
Keywords
💡linear regression
💡data frame
💡XY graph
💡least squares estimates
💡residuals
💡summary function
💡standard error
💡t-value
💡p-value
💡R-squared
💡adjusted R-squared
💡F-value
Highlights
Introduction to Stack West video series and its focus on linear regression in R.
The video is a companion to Stat Quest's content on linear regression.
Assumption that viewers can import data into R for the tutorial.
Explanation of how to structure data into a linear regression model using R.
Demonstration of creating a data frame with weight and size columns.
Use of the plot function to visualize data on an XY graph.
Setting up linear regression with the LM function in R.
Description of the formula used in the LM function to define X and Y values.
Explanation of the summary function and its role in linear regression analysis.
Importance of symmetric distribution of residuals around the fitted line.
Interpretation of the least squares estimates for the intercept and slope.
Significance of P values in determining the usefulness of model parameters.
Desire for the P value of weight to be less than 0.05 for statistical significance.
Explanation of the residual standard error and its calculation.
Discussion of multiple R-squared and adjusted R-squared values.
Interpretation of F value, degrees of freedom, and P-value for model reliability.
How to add the regression line to the initial XY graph.
Encouragement for viewers to subscribe for more Stat Quest content.
Transcripts
Browse More Related Video

Linear Regression, Clearly Explained!!!
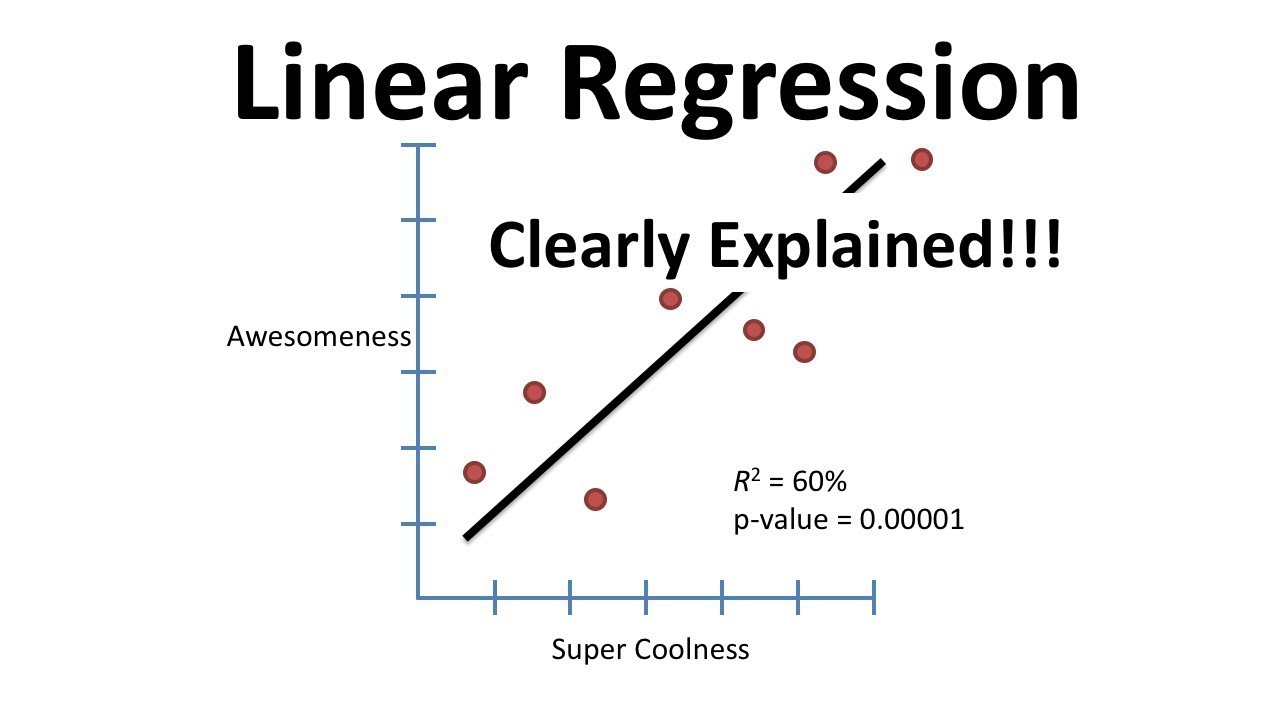
Linear Regression, Clearly Explained!!!

R-squared, Clearly Explained!!!
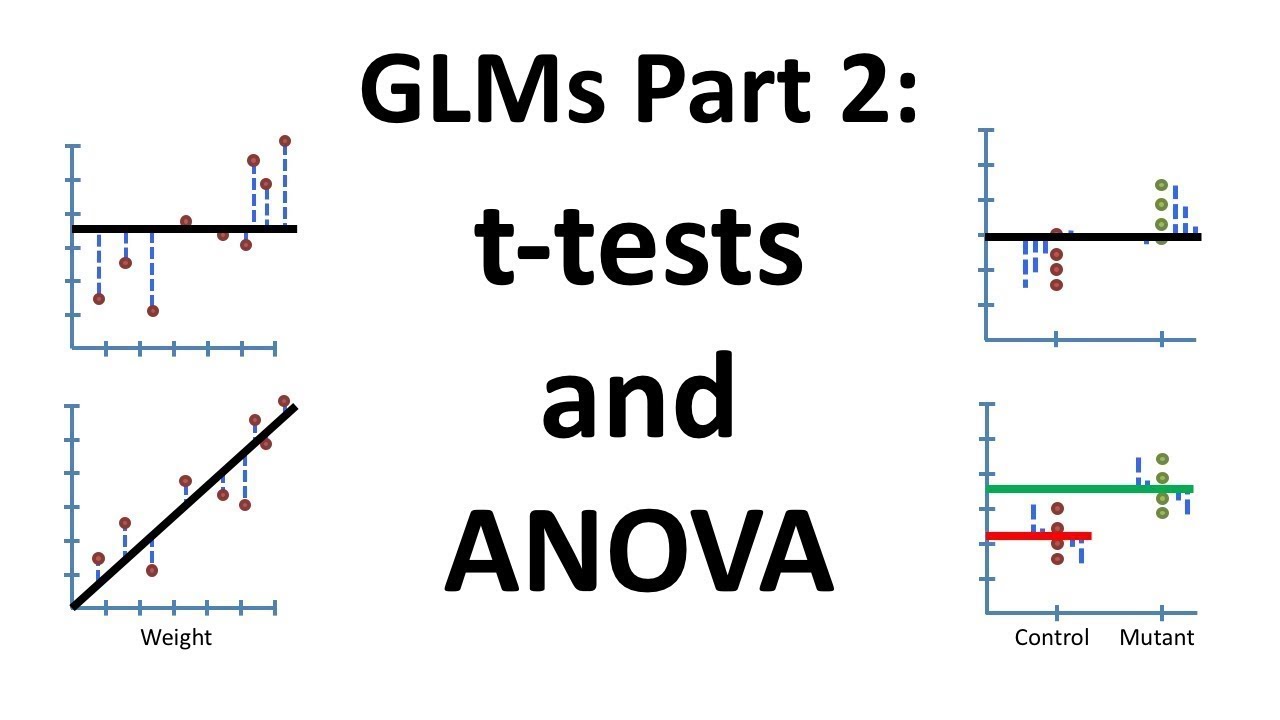
Using Linear Models for t tests and ANOVA, Clearly Explained!!!
Introduction to residuals and least squares regression
Introduction to residuals and least-squares regression | AP Statistics | Khan Academy
5.0 / 5 (0 votes)
Thanks for rating: