Introduction to residuals and least-squares regression | AP Statistics | Khan Academy
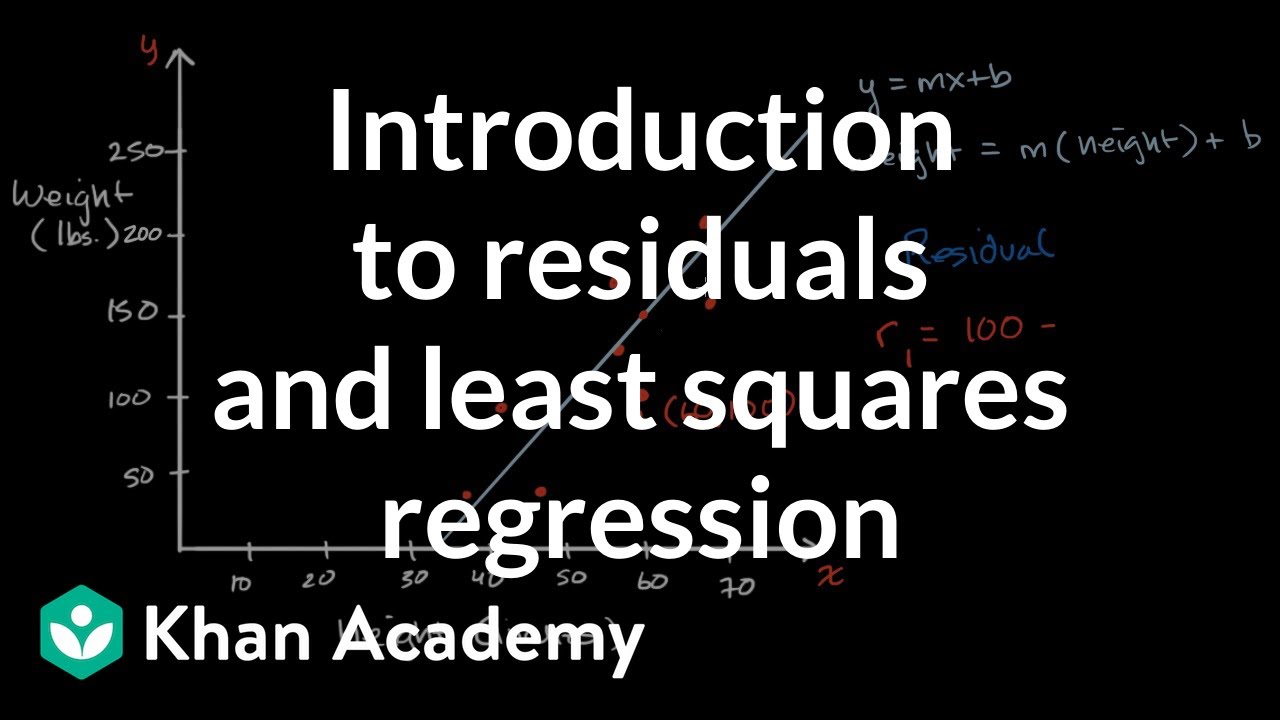
TLDRThe video script introduces the concept of linear regression, a statistical method to model the relationship between two variables, using height and weight as an example. It explains the process of fitting a line to data points on a scatter plot, aiming to minimize the squared distance between the points and the line, known as residuals. The script also touches on the calculation of residuals and their interpretation, highlighting the goal of regression line fitting to minimize these residuals.
Takeaways
- 📊 Understanding the relationship between two variables, such as height and weight, can be visualized using a scatter plot.
- 👥 Each dot on the scatter plot represents an individual with their corresponding height and weight measurements.
- 📈 Linear regression is a method used to fit a line to a set of data points, aiming to find the best relationship between the variables.
- 🔍 The goal of fitting a line is to minimize the distance between the data points and the line, which is often done by minimizing the squared distances.
- 🤔 Eyeballing the data can give an intuitive sense of how well a line fits the data, but mathematical techniques are needed for precise estimation.
- 🎯 The regression line is the line that best fits the data, capturing the general trend of the relationship between the variables.
- 🧠 The equation of the regression line is given by ŷ (y-hat) = ( intercept) + (slope * x), representing an estimated y for a given x.
- 🔄 The actual y-value may not always be on the regression line, as there can be variations and exceptions in the data.
- 💬 The difference between the actual y-value and the estimated y-value (ŷ) from the regression line is known as the residual.
- 📉 A negative residual indicates that the actual y-value is below the regression line estimate, while a positive residual indicates it is above.
- 🌟 Minimizing the sum of the squares of the residuals is a key principle in calculating and refining the regression line in statistical analysis.
Q & A
What is the main topic of the video?
-The main topic of the video is the relationship between people's height and weight, and the concept of linear regression in understanding this relationship.
How does the video introduce the concept of linear regression?
-The video introduces linear regression by discussing the idea of fitting a line to data points on a scatter plot, aiming to minimize the distance between the line and as many points as possible.
What does the video demonstrate with the scatter plot of height and weight?
-The video demonstrates that there is a general trend where as height increases, weight also tends to increase. It uses the scatter plot to visually show this trend and the concept of fitting a line to the data.
What is the purpose of the line fitted in linear regression?
-The purpose of the line fitted in linear regression is to estimate the dependent variable (in this case, weight) based on the independent variable (height), by capturing the general trend of the data.
How is the regression line represented in the video?
-The regression line is represented by the equation y-hat = -140 + (14/3) * x, where y-hat is the estimated weight for a given height x.
What is a residual in the context of linear regression?
-A residual is the difference between the actual value of the dependent variable and the estimated value from the regression line for a specific value of the independent variable.
How does the video explain a negative residual?
-The video explains that a negative residual indicates that for a given value of the independent variable, the actual value of the dependent variable is below the estimated value by the regression line.
What is the goal of calculating residuals in linear regression?
-The goal of calculating residuals in linear regression is to assess how well the fitted line represents the data. The process of fitting the line aims to minimize the sum of the squares of these residuals.
How does the video illustrate the calculation of a residual?
-The video illustrates the calculation of a residual by using the example of a data point with an x-value of 60 (height in inches) and showing how to calculate the estimated y-value (weight) from the regression line and then subtracting it from the actual y-value to find the residual.
What is the significance of minimizing the squared residuals in linear regression?
-Minimizing the squared residuals in linear regression is significant because it helps to find the best-fit line that most accurately represents the relationship between the independent and dependent variables, thus improving the predictive power of the model.
What does the video suggest about the nature of the relationship between height and weight?
-The video suggests that there is a general positive correlation between height and weight, meaning that as height increases, weight tends to increase as well, although there may be exceptions to this trend.
Outlines
📊 Introduction to Linear Regression and Residuals
This paragraph introduces the concept of linear regression by examining the relationship between height and weight. It explains how data points representing individuals are plotted on a scatter plot, with each dot signifying a person's height and weight. The discussion then shifts to fitting a line to these data points, which best represents the trend of increasing weight with height. The method of linear regression is briefly introduced, focusing on the common technique of minimizing the squared distance between data points and the regression line. The concept of residuals is also introduced, explaining how it represents the difference between the actual y-value and the estimated y-value from the regression line for a given x-value. The example provided illustrates how to calculate a residual for a specific data point.
Mindmap
Keywords
💡relationship
💡scatter plot
💡linear regression
💡y-axis
💡residual
💡y-intercept
💡slope
💡eyeballing
💡minimizing squared distance
💡data points
💡trend
Highlights
Understanding the relationship between people's height and weight through data analysis.
Collecting data by measuring the height and weight of 10 different individuals.
Representing each person as a dot on a scatter plot to visualize the data.
Observing a general trend where height and weight seem to increase together.
The concept of linear regression to fit a line to the data points.
Minimizing the squared distance between the data points and the fitted line as a common technique in linear regression.
Eyeballing the data to get an intuitive feel for a good fit.
The equation of the regression line, denoted as y-hat, to estimate y for a given x.
The y-intercept of the regression line is negative 140.
The slope of the regression line is 14/3, representing the change in weight for each increase in height.
The concept of residuals, which represent the difference between the actual and estimated values.
Calculating the residual for a specific data point where x is 60.
The residual can be positive or negative, indicating whether the actual y-value is above or below the regression line estimate.
The ultimate goal in regression line calculation is to minimize the square of the residuals.
The process of fitting a line to data involves both visual inspection and mathematical calculation.
The importance of understanding the trend and potential outliers in data analysis.
The practical application of linear regression in understanding relationships between two variables.
Transcripts
Browse More Related Video
Introduction to residuals and least squares regression
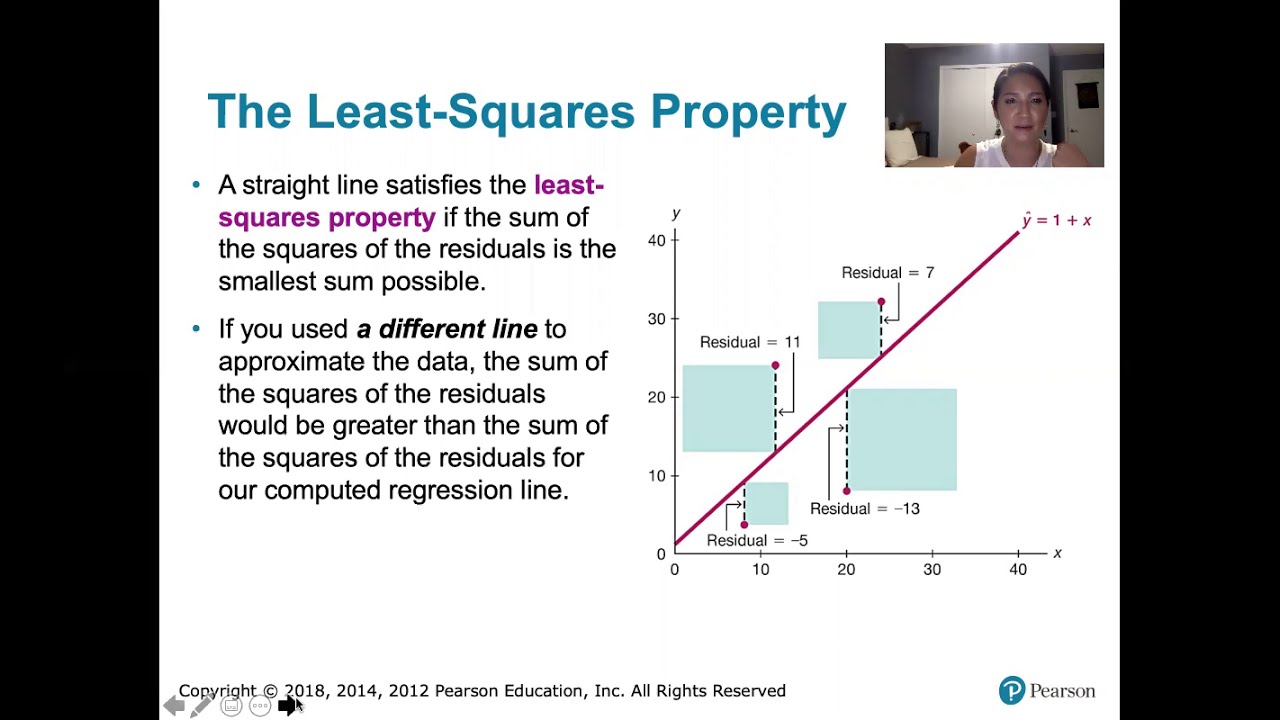
10.2.5 Regression - Residuals and the Least-Squares Property
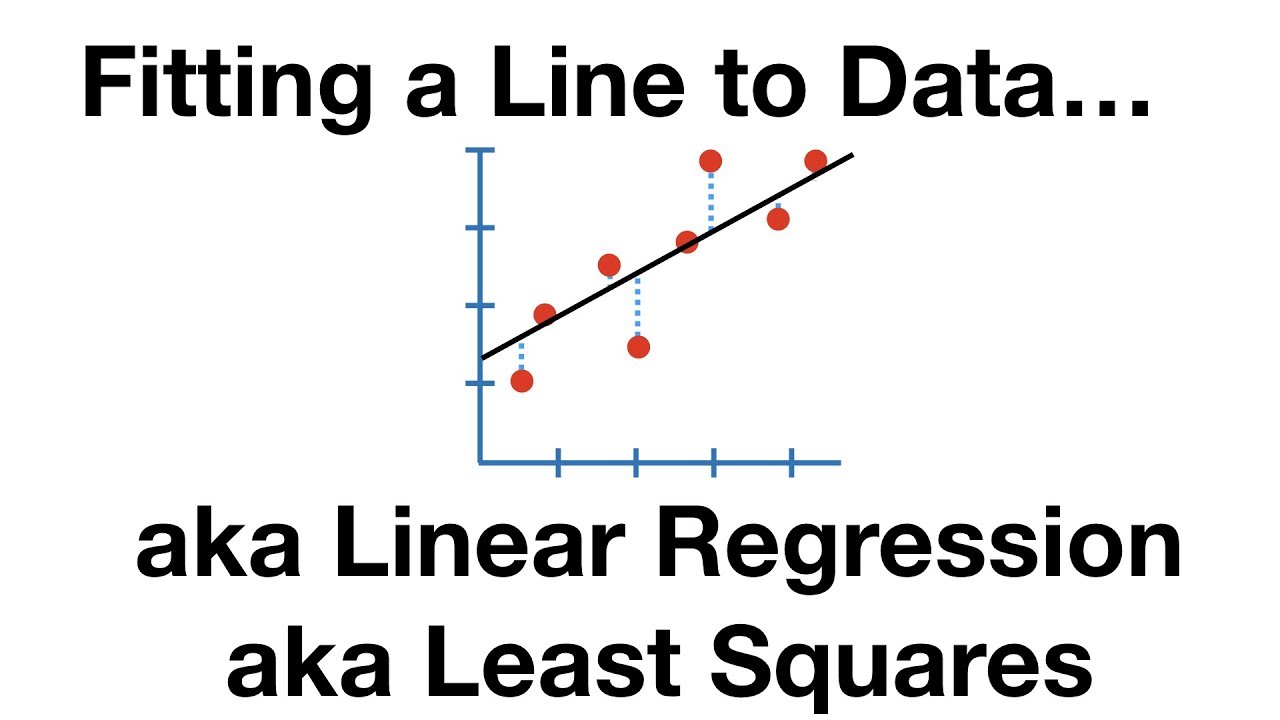
The Main Ideas of Fitting a Line to Data (The Main Ideas of Least Squares and Linear Regression.)
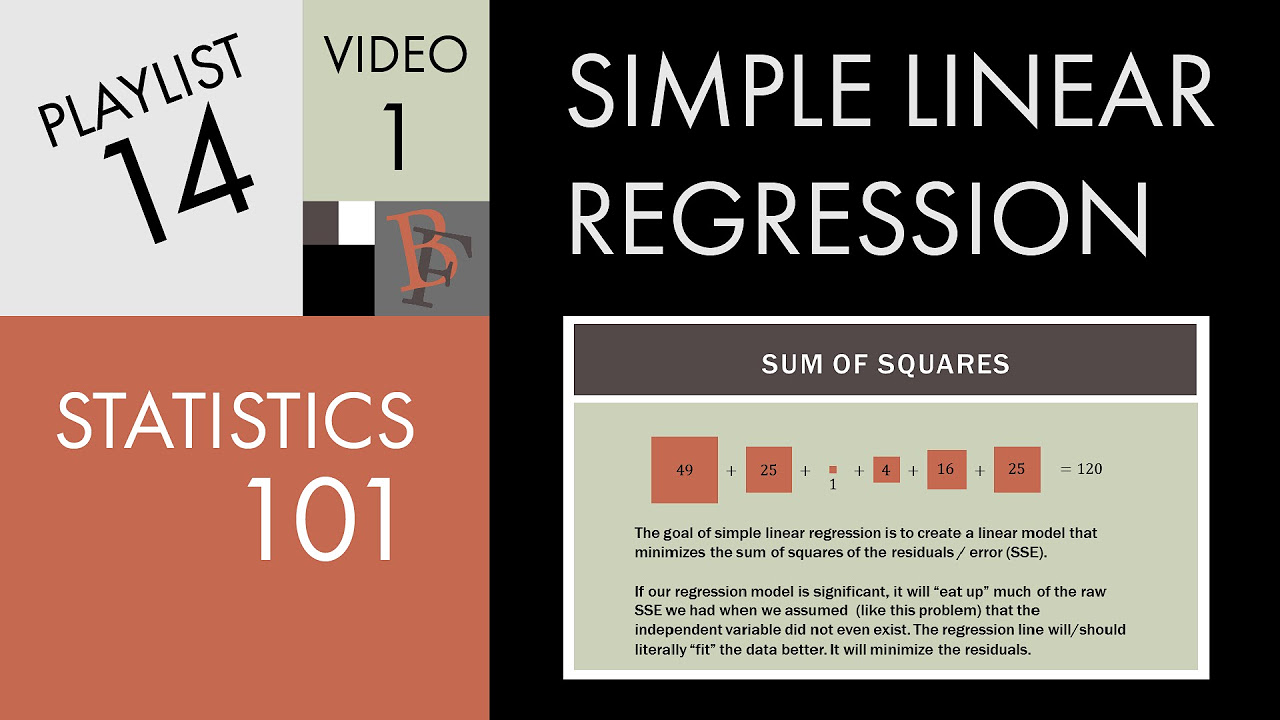
Statistics 101: Linear Regression, The Very Basics 📈
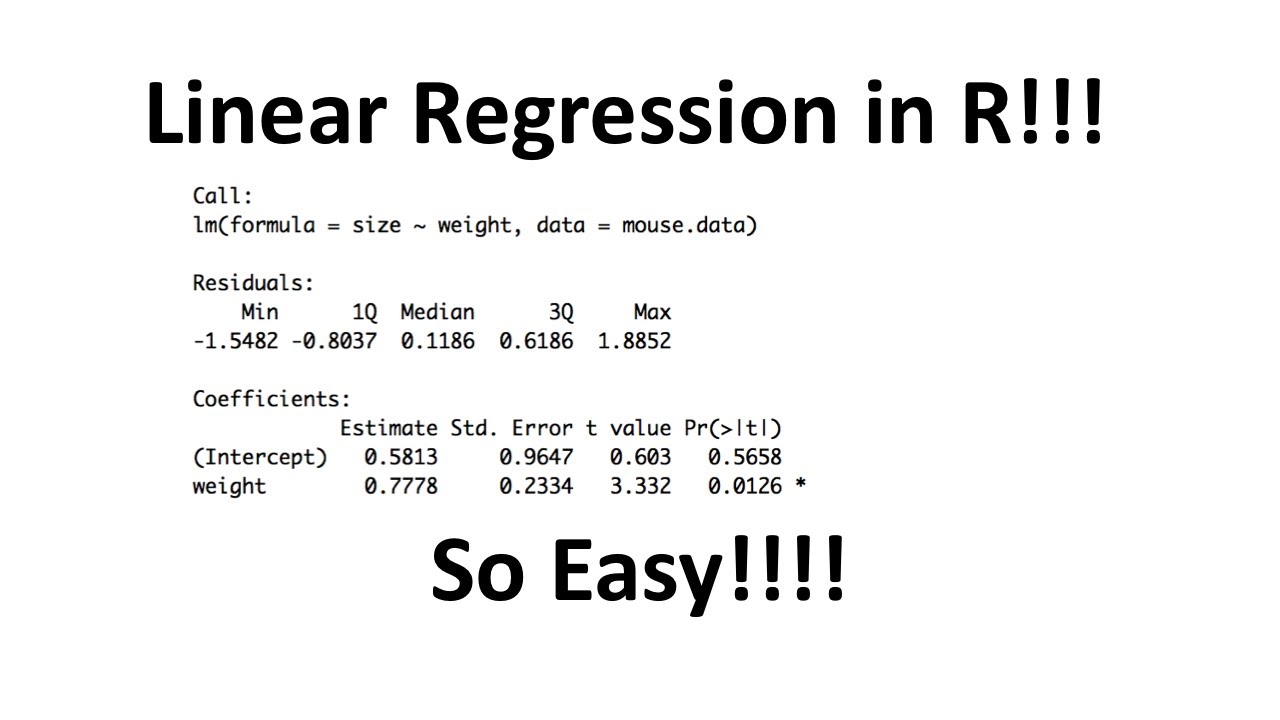
Linear Regression in R, Step-by-Step
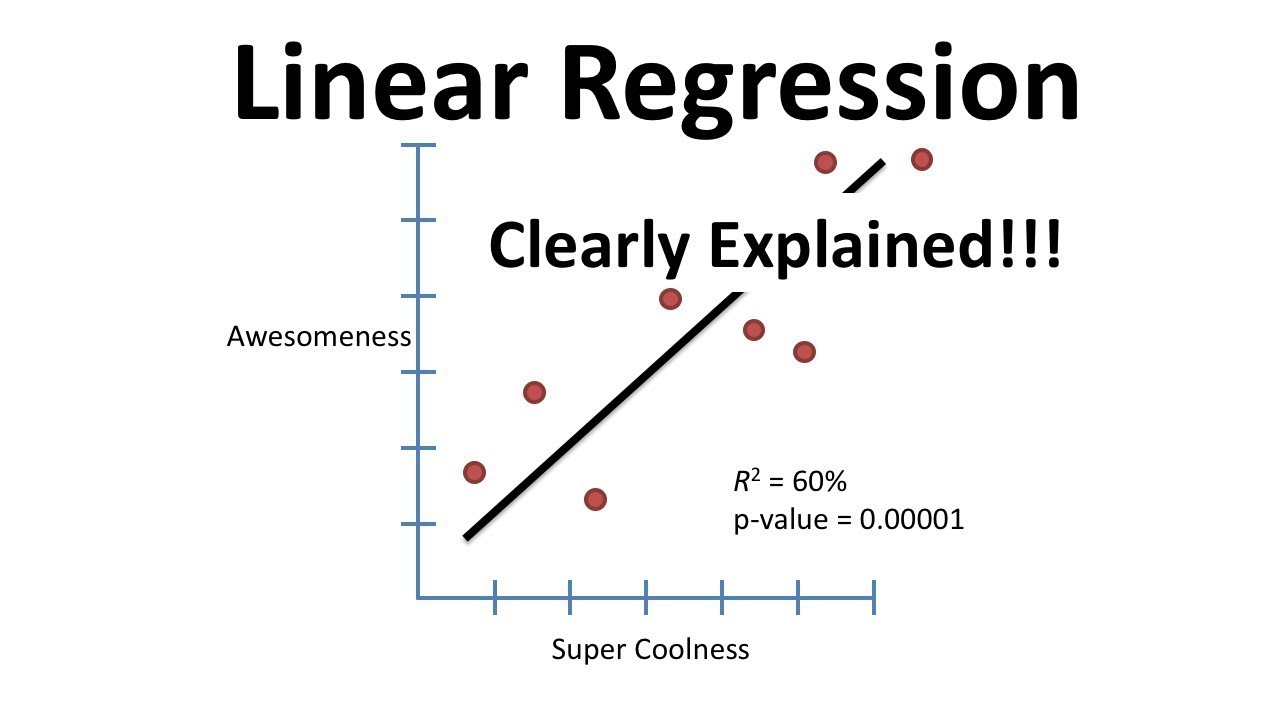
Linear Regression, Clearly Explained!!!
5.0 / 5 (0 votes)
Thanks for rating: