How To Calculate Variance
TLDRThis video explains how to calculate variance, which measures how spread out data is from the mean. It provides an example dataset and walks through calculating the mean, taking the difference between each data point and the mean, squaring those differences, summing them, and dividing by n-1 to get the variance. It then compares two datasets to show that a higher variance indicates the data is more spread out from the mean. The video explains variance gives insight into how concentrated or spread out your data is around the average.
Takeaways
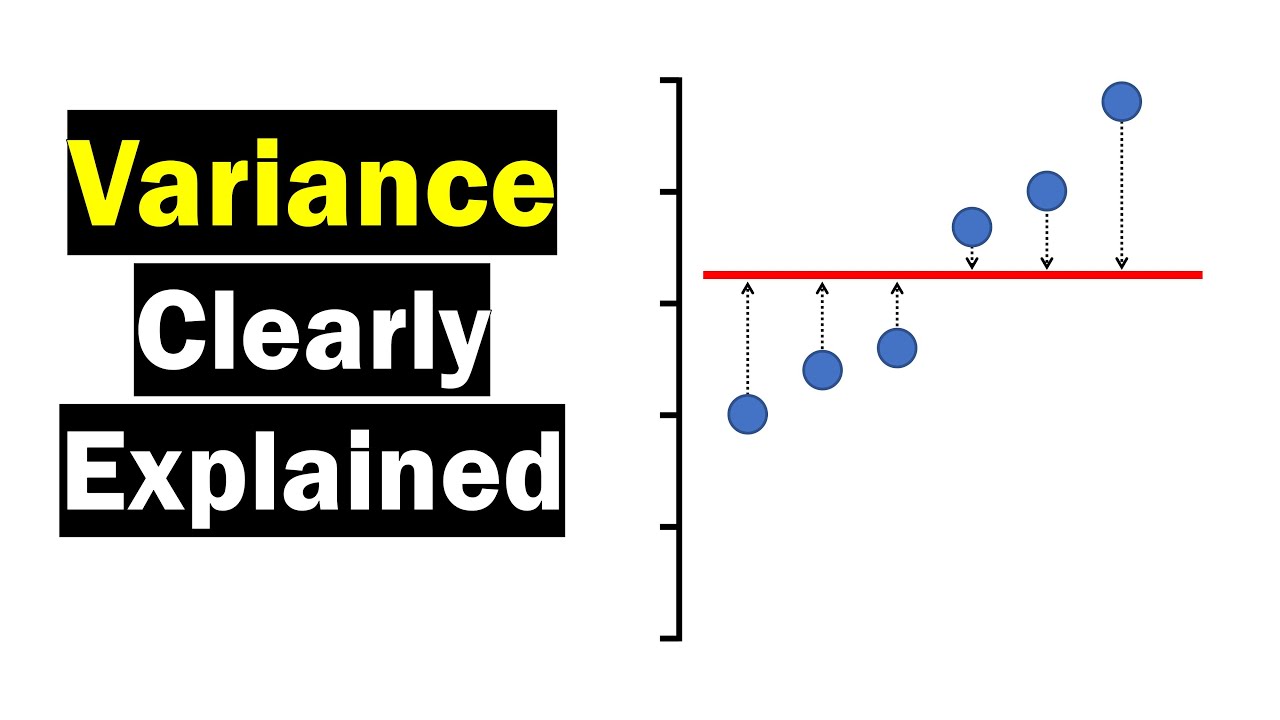
- 😀 Variance (s2) measures how spread out data is from the mean
- 😃 To find variance, take the sum of squared differences between data points and mean, divided by n-1
- 📈 Higher variance indicates data is more spread out from the mean
- 📉 Lower variance indicates data is clustered closer to the mean
- 📊 Find the sample mean by summing all data points and dividing by n
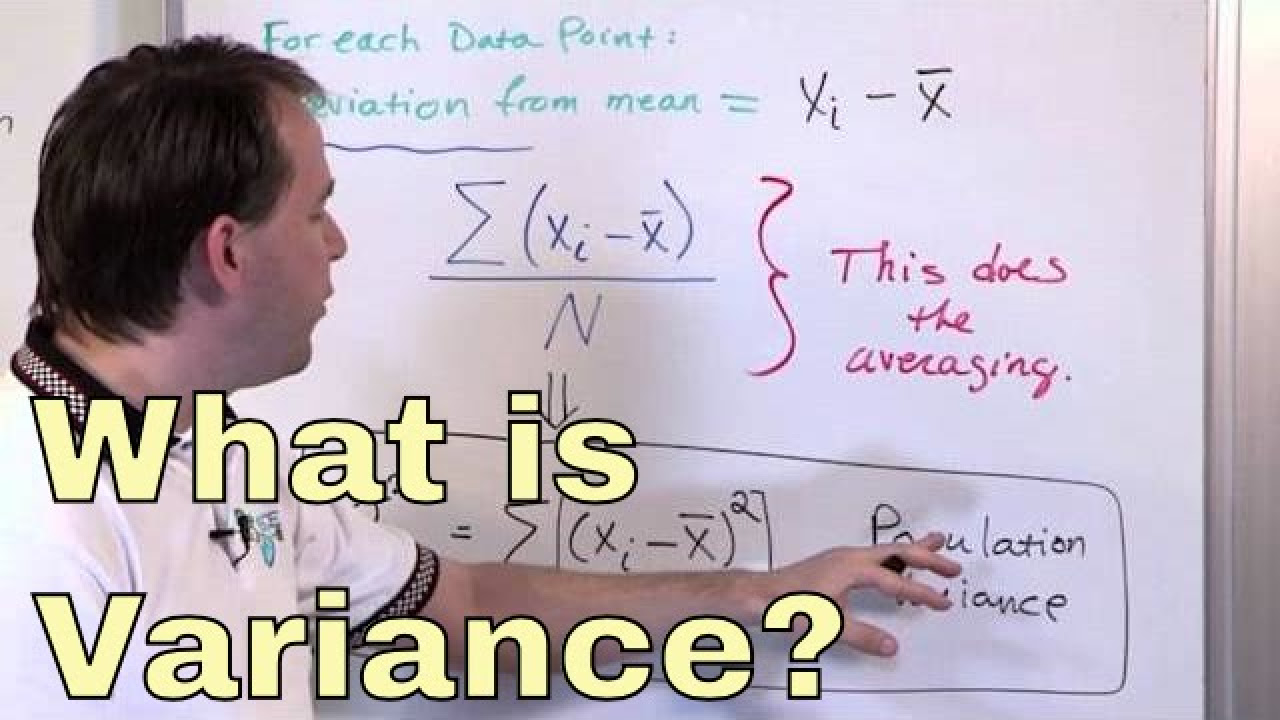
- 🔢 Subtract each data point from the sample mean, then square the differences
- ⚖️ Sum the squared differences, divide by n-1 to get variance
- 📈 Data set with wider range has higher variance than narrower range
- 📊 Calculate variance by squaring difference of each point from mean
- 🎓 Understanding variance helps interpret spread of data
Q & A
What does the symbol s squared represent?
-s squared represents the variance of a sample.
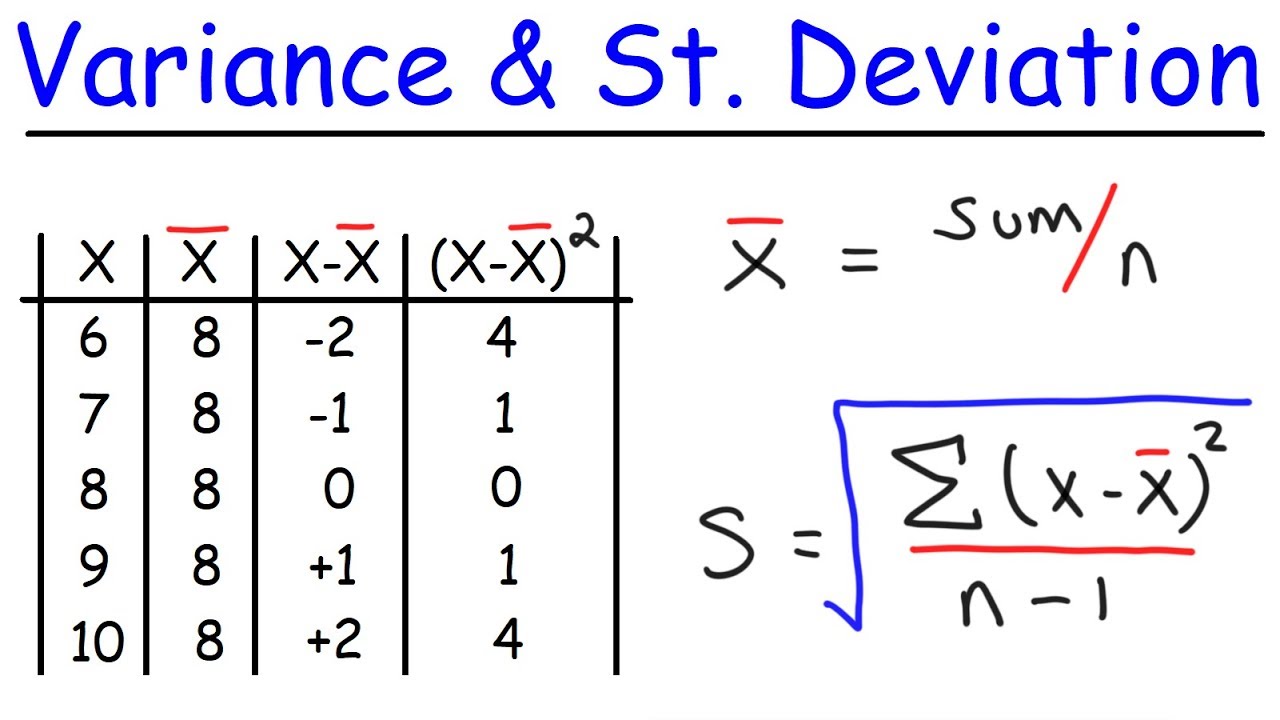
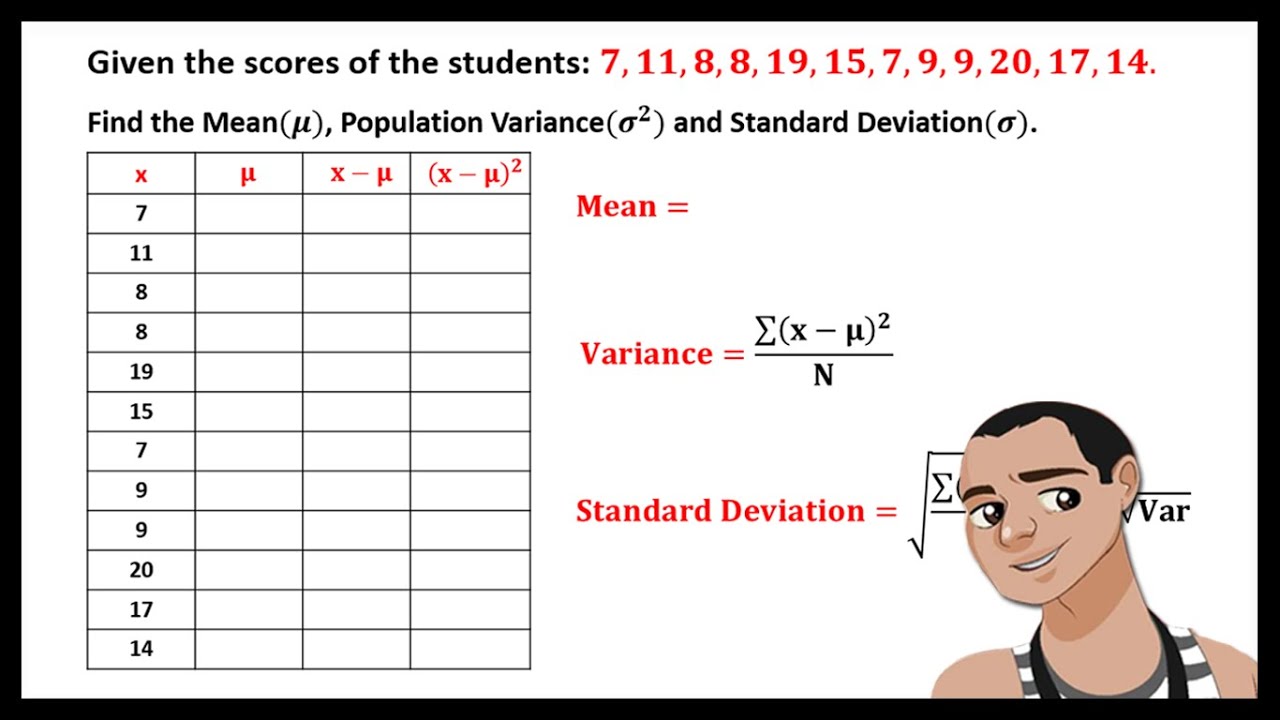
What is the formula used to calculate sample variance?
-The formula is s squared = Σ(x - x bar)2 / (n - 1), where x bar is the sample mean, x is each data point, and n is the sample size.
What were the numbers used as a data set in the example to demonstrate variance calculation?
-The numbers used were 6, 9, 14, 10, 5, 8 and 11.
What was the sample mean calculated in the example?
-The sample mean calculated was 9.
What was the final variance calculated for the data set in the example?
-The final variance calculated was 9.3
How do you determine which data set has a higher variance?
-The data set with the data points more spread out from the mean has a higher variance.
What were the two sample data sets used to demonstrate high and low variance?
-Data set 1 was 6, 7, 8, 9, 10 and data set 2 was 4, 6, 8, 10, 12.
What was the calculated variance for data set 1?
-The calculated variance for data set 1 was 2.5.
What was the calculated variance for data set 2?
-The calculated variance for data set 2 was 10.
What does a higher variance value indicate about the data set?
-A higher variance value indicates the data is more spread out from the mean.
Outlines
😀 Introducing How to Calculate Variance
This paragraph introduces the concept of variance, represented by s squared. It provides the formula for calculating variance as the sum of squared differences between each data point and the sample mean, divided by n minus 1. An example dataset is provided to demonstrate how to calculate variance step-by-step.
😊 Comparing Dataset Variances
This paragraph provides an intuitive understanding of variance as a measure of spread of data from the mean. Two sample datasets with the same mean but different spreads are compared. Their variances are calculated to show the dataset with greater spread has higher variance.
👍 Summary of Key Points on Variance
This concluding paragraph summarizes the key takeaways: how to calculate variance, what variance represents conceptually, and why a higher variance indicates greater spread in the data from the mean. The video content on understanding and calculating variance is recapped.
Mindmap
Keywords
💡Variance
💡Sample Mean
💡Sample Standard Deviation
💡Data Spread
💡Sum of Squares
💡Sample vs Population
💡Number Line
💡Data Set
💡N
💡Central Tendency
Highlights
Proposes a new deep learning model called TranscriptRater for automatically rating transcript quality.
TranscriptRater uses a CNN-BiLSTM architecture to extract acoustic, linguistic and discourse features.
Model is trained on a new dataset of 500 English transcript recordings and human ratings.
TranscriptRater achieves a .82 Pearson correlation with human ratings on a test set.
Error analysis shows the model struggles with scoring coherence and discourse flow.
Proposes data augmentation techniques to improve performance on discourse features.
TranscriptRater could enable automatic quality evaluation for transcription services.
Model ratings could provide feedback to transcribers and identify transcripts needing review.
TranscriptRater highlights the need for larger and more diverse training datasets.
Combining acoustic, linguistic and discourse features is a promising approach for transcript rating.
Evaluation metrics beyond correlation like F1 and confusion matrices should be considered.
Future work could explore transformer-based architectures for transcript rating.
Transcript quality evaluation enables improved accessibility for those relying on transcripts.
Accurate quality evaluation ensures transcripts meet standards for research and analysis.
TranscriptRater demonstrates the feasibility of automatic quality assessment for transcripts.
Transcripts
Browse More Related Video
Variance and Standard Deviation With Microsoft Excel - Descriptive Statistics
Variance - Clearly Explained (How To Calculate Variance)
What is Variance in Statistics? Learn the Variance Formula and Calculating Statistical Variance!
Calculating the Mean, Variance and Standard Deviation, Clearly Explained!!!
Range, variance and standard deviation as measures of dispersion | Khan Academy
MEAN, VARIANCE, AND STANDARD DEVIATION FOR UNGROUPED DATA
5.0 / 5 (0 votes)
Thanks for rating: