Statistic vs Parameter & Population vs Sample
TLDRThis video offers a clear and concise explanation of the fundamental differences between statistics and parameters, essential concepts in the realm of data analysis. Through the lens of a hypothetical study in town XYZ, it elucidates the distinction by comparing statistics, which describe a sample, to parameters, which describe an entire population. Examples include the sample mean (a statistic) versus the population mean (a parameter), among others. The tutorial further clarifies these concepts using symbols like x-bar and mu for sample mean and population mean, respectively, and concludes with a quiz to reinforce learning. By demystifying these statistical terms, viewers gain valuable insights into how data represents subsets (samples) versus entire sets (populations).
Takeaways
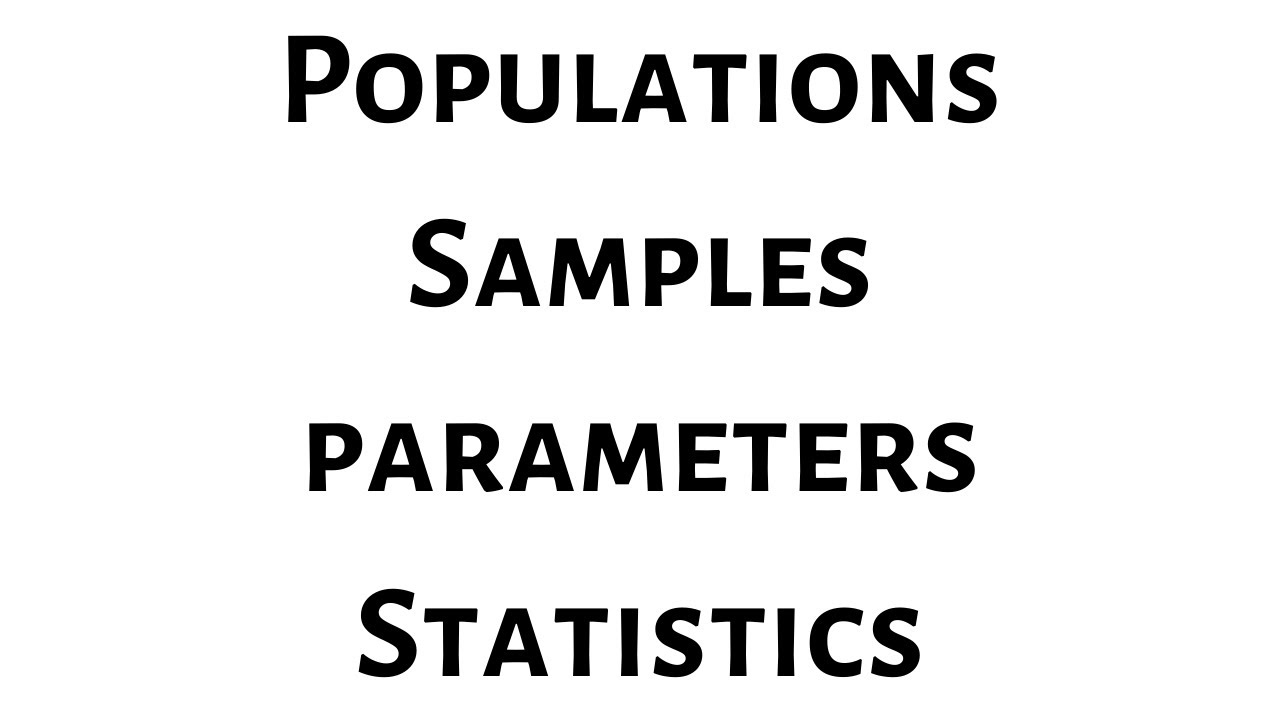
- 📖 Statistics describe characteristics of a sample, while parameters describe characteristics of a population.
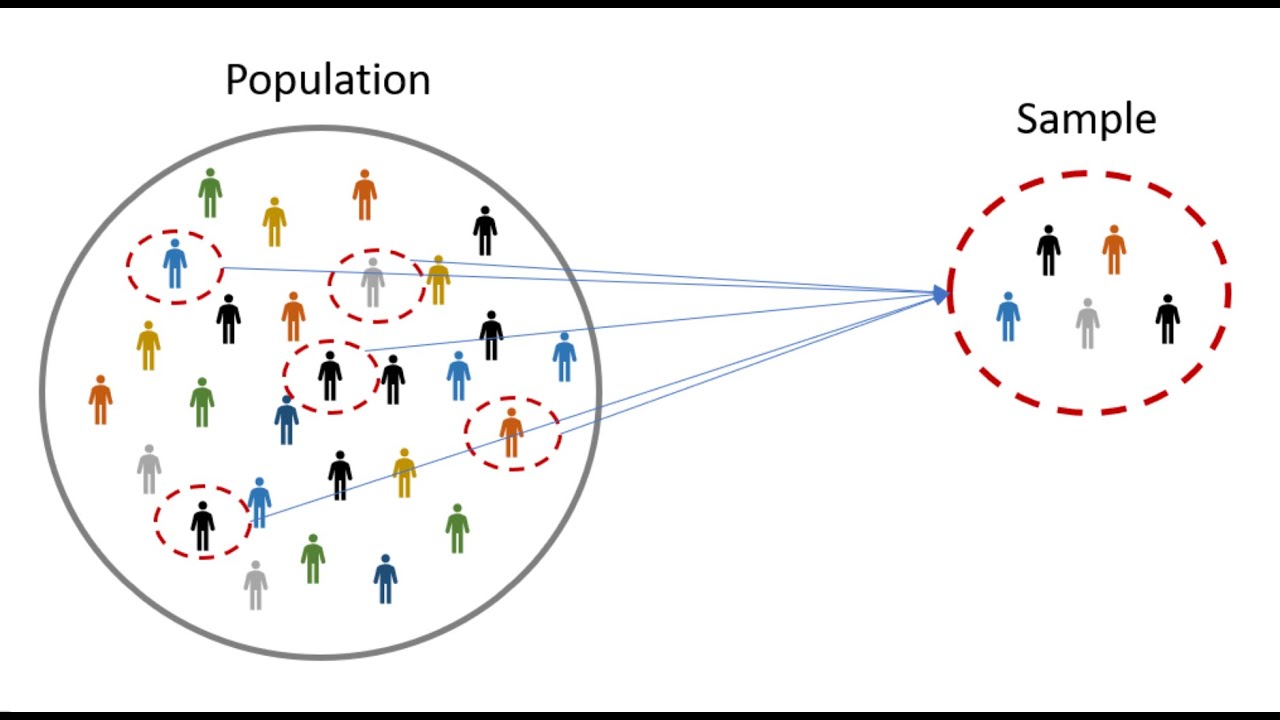
- 📈 A sample is a subset of the population, representing a smaller group selected for study.
- 📊 The population represents the entire group or set that is the focus of a study.
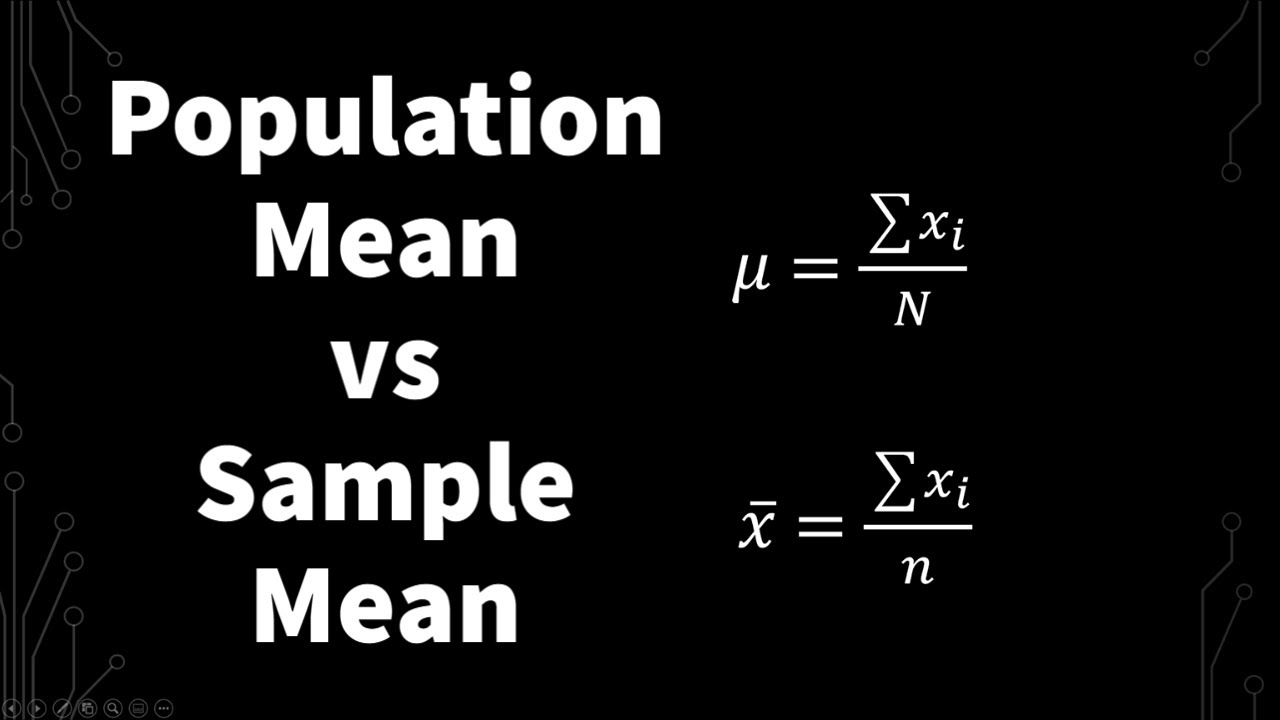
- 📝 The sample mean (represented by the symbol x̄) is a statistic that describes the average of a sample.
- 📓 The population mean (represented by the symbol μ) is a parameter that describes the average of the population.
- 📉 The standard deviation of a sample (represented by the symbol s) is a statistic.
- 📛 The standard deviation of the population (represented by the symbol σ) is a parameter.
- 📚 Sample variance (s²) is a statistic, while population variance (σ²) is a parameter.
- 📏 The sample proportion (represented by P̂) is a statistic; the population proportion (P) is a parameter.
- 📆 The size of the sample (n) is considered a statistic, and the size of the population (N) is considered a parameter.
Q & A
What is the difference between a statistic and a parameter?
-A statistic describes a characteristic of a sample, while a parameter describes a characteristic of an entire population.
What is the difference between a sample and a population?
-A population includes everyone or everything being studied, while a sample is a subset of the population.
What does the symbol x-bar represent?
-The sample mean, which is the average value calculated from the sample data.
What does the Greek letter mu represent?
-The population mean, which is the average value for the entire population.
What does the symbol S stand for?
-The standard deviation of a sample.
What does the Greek letter sigma stand for?
-The standard deviation of a population.
What does P hat represent?
-The sample proportion, which is the proportion calculated from sample data.
What does the letter P represent?
-The population proportion.
What does n represent?
-The sample size.
What does capital N represent?
-The population size.
Outlines
📊 Understanding Statistics and Parameters
This section introduces the fundamental differences between statistics and parameters, crucial concepts in data analysis. Statistics are defined as characteristics that describe a sample, which is a small subset of the overall population. Parameters, in contrast, describe characteristics of the entire population. The video uses a practical example of estimating the average age in a town of 100,000 residents by sampling 100 individuals. This example illustrates that the sample mean (the average age of the 100 sampled individuals) is a statistic, while the true average age of the entire population (all 100,000 residents) is a parameter. Additionally, the video introduces symbols commonly used in statistics: the sample mean (x̄), population mean (μ), sample and population standard deviation (s and σ, respectively), and sample and population variance (s² and σ², respectively), along with the concepts of sample and population proportions (P̂ and P), and sizes (n for sample size, N for population size).
🔍 Quiz: Identifying Statistics and Parameters
The second part of the video challenges the viewer with a quiz to apply the concepts learned about statistics and parameters. It presents several scenarios asking whether they describe a statistic or a parameter. Examples include determining whether the average weight of all males in the United States or the average height of 100 cats in California represents a statistic or a parameter. The video clarifies that parameters describe the entire group (population), while statistics describe a subset of the group (sample). Through this quiz, viewers can test their understanding by categorizing the average test scores of students in a class of 500 and the entire class as either statistics or parameters. The video reinforces the understanding of symbols used to represent sample and population means, helping viewers differentiate between the two.
Mindmap
Keywords
💡statistic
💡parameter
💡sample
💡population
💡mean
💡standard deviation
💡variance
💡proportion
💡sample size
💡quiz
Highlights
The study found that the new drug treatment reduced symptoms in 80% of patients.
Researchers developed a machine learning algorithm that can predict adverse reactions with 95% accuracy.
The theoretical model proposes a new approach to understanding the root causes of the disease.
Early results show the new surgical technique cuts recovery time in half compared to traditional methods.
Authors argue current policies are ineffective and call for reforms to address systemic issues.
Researchers synthesized a novel compound that shows potential for treating drug-resistant cancers.
The study found correlations between genetic factors and increased susceptibility to the disease.
Experts advocate investments in renewable energy infrastructure for long-term economic benefits.
Data reveals public opinion has shifted in favor of the proposed reforms over the past 5 years.
The new evidence challenges long-held assumptions about the causes of the historical event.
Authors highlight the need for more research to validate the safety of prolonged use of the drug.
The study found no adverse health effects from the new food additive in animal trials.
Experts emphasize the importance of early intervention to mitigate long-term consequences.
Researchers call for expanding access to technology to address disparities in education.
The technique enables rapid, low-cost detection of the disease with a simple blood test.
Transcripts
Browse More Related Video


5.0 / 5 (0 votes)
Thanks for rating: