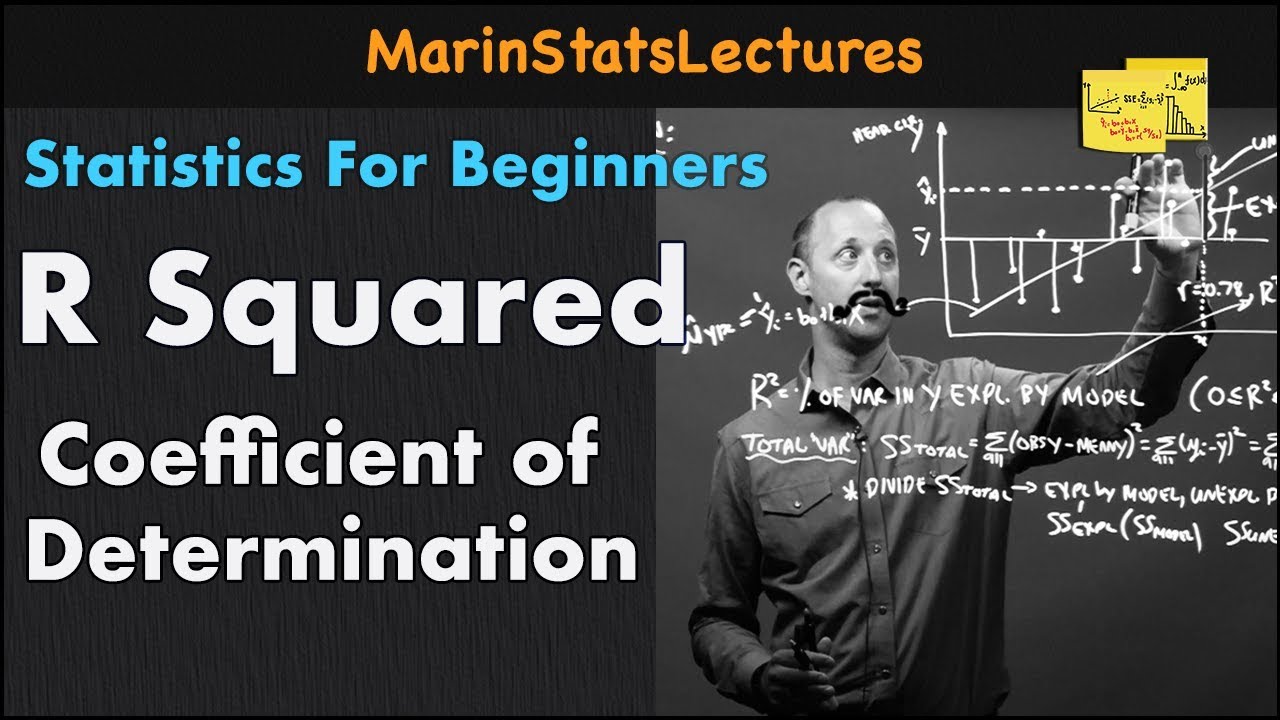
R-squared, Clearly Explained!!!
TLDRThe video script from Stat Quest introduces R-squared, a metric of correlation that is easily computed and interpreted. It explains how R-squared, the square of the correlation coefficient R, quantifies the proportion of variance for one variable that's predictable from the other. The script uses examples with mouse weight and size, and mouse weight and time spent sniffing a rock, to illustrate how R-squared can range from 0 to 1, indicating the percentage of total variation explained by the relationship. It highlights the ease of interpretation and the significance of R-squared in understanding the strength of a correlation compared to the raw R value.
Takeaways
- 📊 R-squared (R²) is a metric of correlation that is easy to compute and interpret.
- 🔄 R-squared is similar to the correlation coefficient (R), but offers easier interpretation.
- 📈 An R-squared value of 1 indicates that the model explains all the variation in the data, while 0 means it explains none.
- 🔢 R-squared is calculated by dividing the sum of squared differences between actual data points and their mean by the sum of squared differences between actual data points and the fitted line.
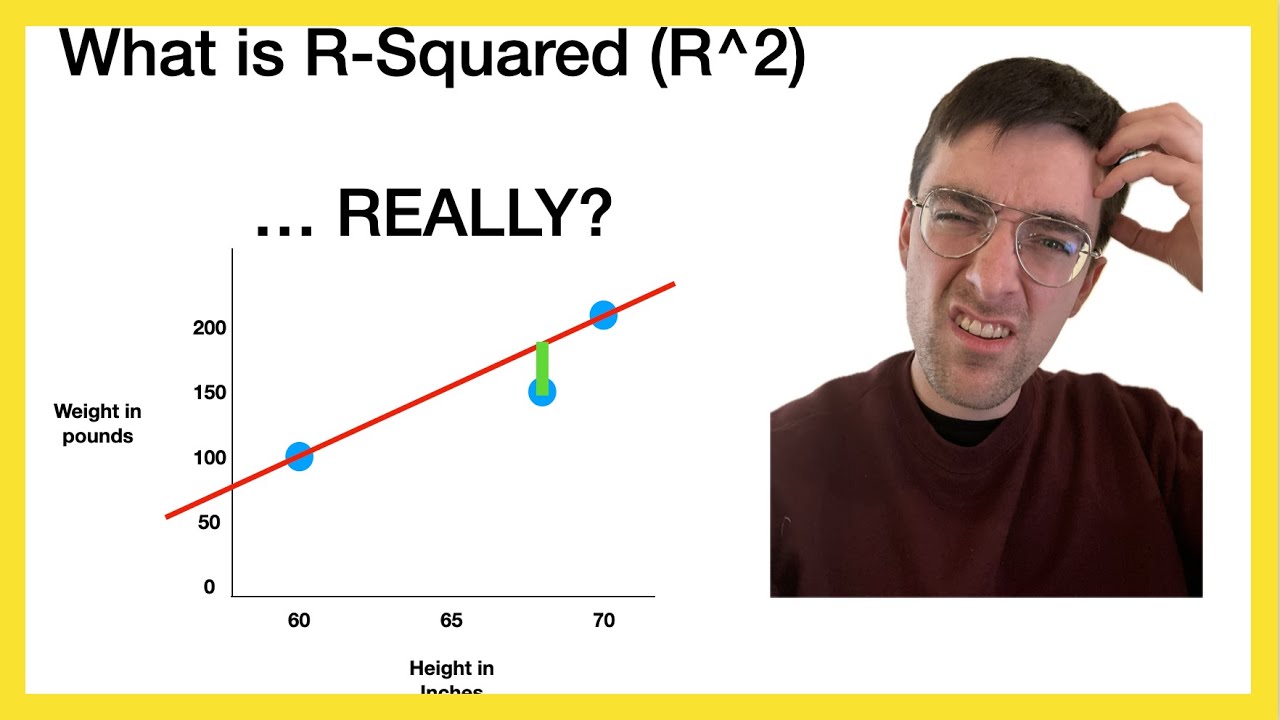
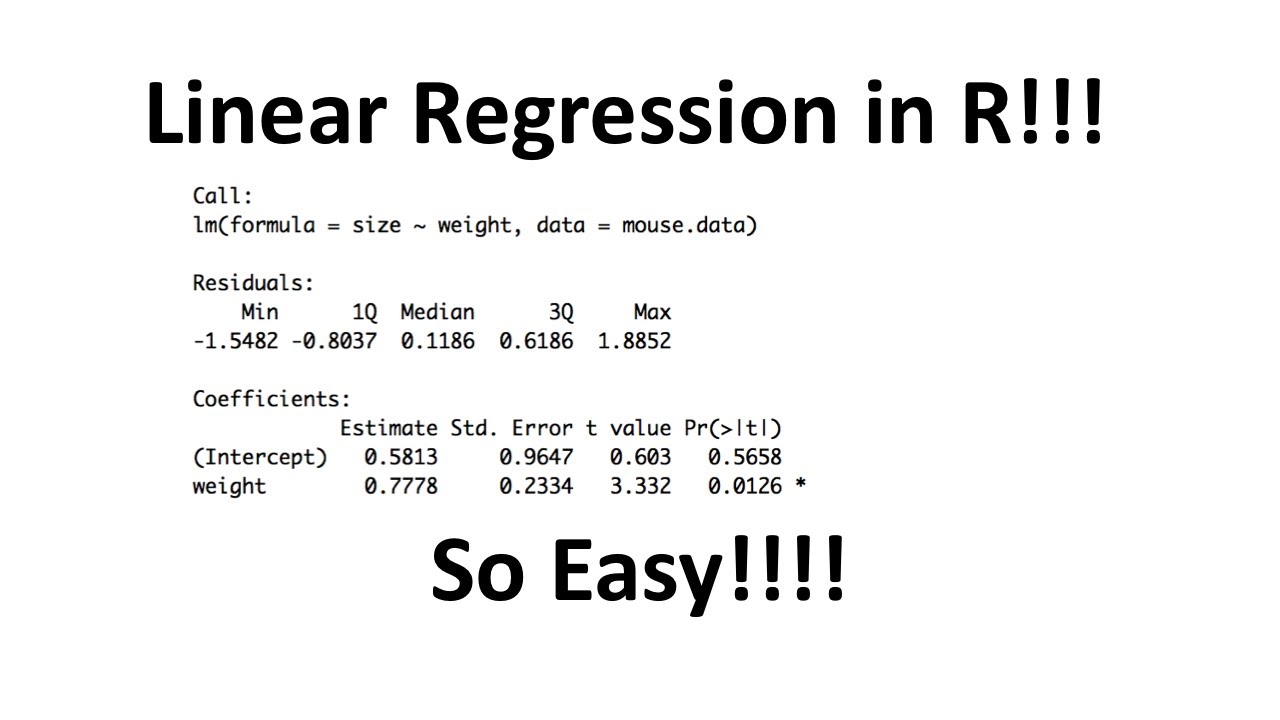
- 🐭 The example of mouse weight and size demonstrates how R-squared can quantify the goodness of fit of a model.
- 📉 When comparing unrelated variables (e.g., mouse weight and time spent sniffing a rock), R-squared can show how little the relationship explains the data variation.
- 🅿️ A high R-squared value (e.g., 0.9) means 90% of the data variation is explained by the relationship between variables.
- 🅰️ A low R-squared value (e.g., 0.01) indicates that only 1% of the variation is explained, and other factors likely account for most of the data's variability.
- 🔢 The relationship between R and R-squared is that R-squared is the square of the R value (e.g., R=0.9 leads to R²=0.81).
- ⏩ Converting R to R-squared in your head can provide a clearer understanding of how much variation is explained by the relationship.
- 🚫 R-squared does not indicate the direction of the correlation, as squared values are always positive.
Q & A
What is the main topic of the video?
-The main topic of the video is r-squared (R²), a metric of correlation that is easy to compute and interpret in statistics.
How is r-squared related to the standard metric of correlation, R?
-R-squared is related to R as it is the square of the correlation coefficient (R). It provides a percentage that represents the proportion of the variance for the dependent variable that's explained by the independent variables in a regression model.
Why might R-squared be preferred over R in interpreting a correlation?
-R-squared is often preferred because it provides an easier interpretation as it represents the proportion of variance explained by the model, and its value ranges from 0 to 1, making it intuitive to understand the strength of the correlation.
What does an R-squared value of 0.7 signify?
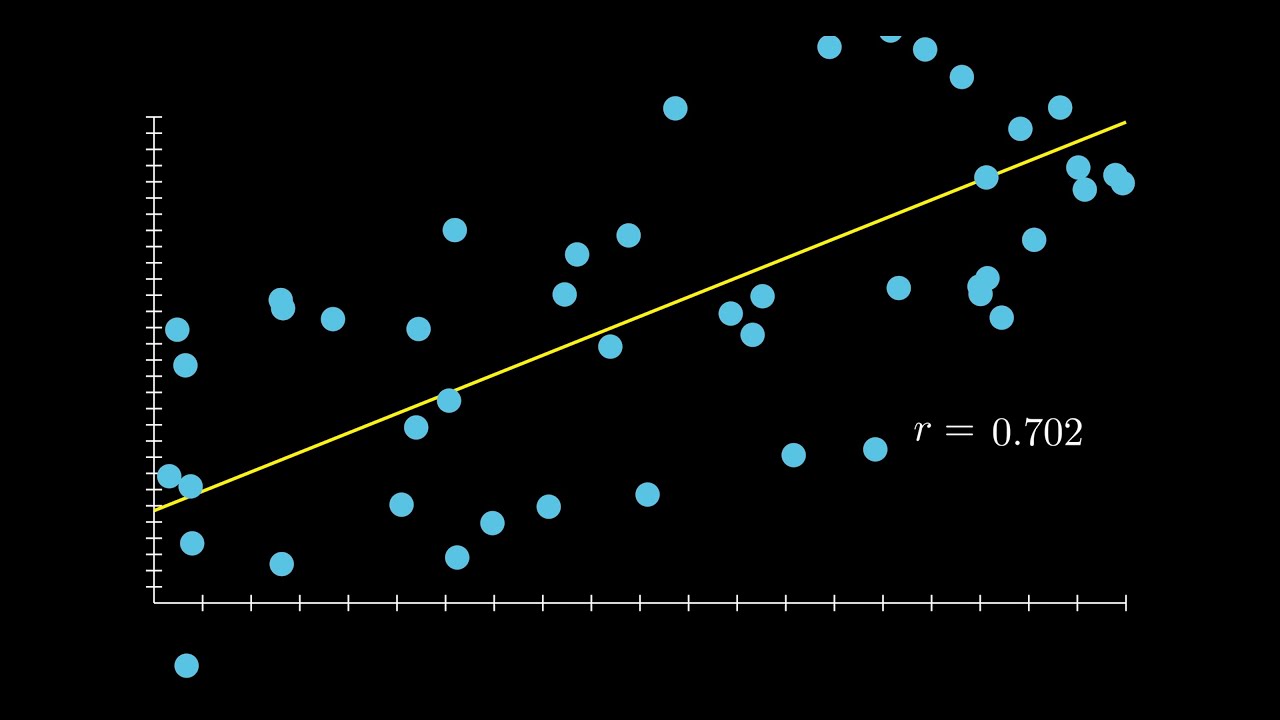
-An R-squared value of 0.7 means that 70% of the variance in the dependent variable can be explained by the relationship with the independent variable(s) in the regression model.
How is the variation around the mean calculated in the video example?
-The variation around the mean is calculated by summing the squared differences between each data point's weight and the mean weight of all data points.
What is the formula for calculating R-squared?
-The formula for calculating R-squared is (1 - (Sum of squared differences around the regression line / Sum of squared differences around the mean)). It essentially measures how much better the regression line fits the data compared to simply using the mean.
What does a low R-squared value, like 0.06, indicate?
-An R-squared value of 0.06 indicates that only 6% of the variance in the dependent variable can be explained by the relationship with the independent variable(s), suggesting a weak explanatory power of the model.
How can you interpret a statistically significant R-squared value of 0.9?
-A statistically significant R-squared value of 0.9 indicates that 90% of the variation in the data can be explained by the relationship between the variables, which is a strong correlation.
What does the direction of correlation mean in the context of R-squared?
-R-squared does not indicate the direction of the correlation because it is a squared value and cannot be negative. However, the direction (positive or negative) can be inferred from the context or by looking at the original R value before squaring.
How can you relate R-squared back to R?
-To relate R-squared back to R, you square the R value. For example, if R is 0.9, then R-squared is 0.9 * 0.9 = 0.81, which means 81% of the variation is explained by the relationship.
What is the significance of R-squared in statistical analysis?
-The significance of R-squared in statistical analysis is that it provides a clear and quantifiable measure of how much of the variance in one variable can be explained by the variance in another variable(s), which helps in understanding the strength and effectiveness of the relationship in a model.
Outlines
📊 Introduction to R-Squared
This paragraph introduces the concept of R-squared as a metric of correlation, emphasizing its ease of computation and intuitive interpretation. It contrasts R-squared with the standard correlation coefficient (R), highlighting the benefits of R-squared in terms of its interpretability and calculation. The paragraph sets the stage for a deeper exploration of R-squared by discussing its significance in understanding the relationship between two quantitative variables, such as weight and size, and how it can be used to predict outcomes based on known variables.
🧮 Calculation and Interpretation of R-Squared
This section delves into the process of calculating R-squared and interpreting its value. It begins by explaining the concept of variation around the mean and how it is calculated. The paragraph then illustrates the calculation of variation around a fitted line (the 'Blue Line' in the example) and how this relates to R-squared. The explanation includes a step-by-step example where mouse weight is plotted against mouse size, and the variation around the mean and the Blue Line is calculated. The resulting R-squared value is then used to determine the percentage of variation explained by the relationship between the two variables.
🔢 Understanding the Practical Implications of R-Squared
The final paragraph discusses the practical implications of R-squared values in statistical analysis. It explains how R-squared can be used to gauge the strength of the relationship between two variables and the proportion of variation explained by this relationship. The paragraph contrasts examples with high and low R-squared values to demonstrate their significance. It also touches on the limitations of R-squared, such as its inability to indicate the direction of correlation. The section concludes by reinforcing the importance of R-squared in statistical analysis and encourages viewers to apply this knowledge in their understanding of future statistical concepts.
Mindmap
Keywords
💡R-squared
💡Correlation
💡Regression Line
💡Variation
💡Mean
💡Sum of Squared Differences
💡Statistical Significance
💡Data Points
💡Predict
💡Positive Correlation
💡Negative Correlation
Highlights
R-squared (r^2) is a metric of correlation that is easy to compute and intuitive to interpret.
R-squared is similar to the standard metric of correlation, R, but offers easier interpretation.
An R-squared value of 0.7 indicates 1.4 times better correlation than R-squared at 0.5.
R-squared is calculated by comparing the variation around the mean to the variation around a fitted line.
The equation for R-squared is derived by dividing the difference in variation between the mean and the fitted line by the variation around the mean.
R-squared ranges from 0 to 1 and represents the percentage of variation explained by the relationship between two variables.
An R-squared value of 0.81 or 81% indicates that 81% of the total variation is explained by the size-weight relationship.
Comparing two uncorrelated variables, R-squared can show the percentage of variation explained by each relationship.
An R-squared of 0.06 or 6% indicates that only 6% of the total variation is explained by the sniff-weight relationship.
A statistically significant R-squared of 0.9 means that 90% of the variation in the data is explained by the relationship between the two variables.
A statistically significant R-squared of 0.01 means that only 1% of the variation in the data is explained by the relationship, with 99% unaccounted for.
R-squared is the square of R, making it easier to understand the proportion of variation explained by squaring the correlation coefficient.
R-squared does not indicate the direction of the correlation, as squared numbers are never negative.
R-squared is preferred over plain R because it provides a clearer understanding of the proportion of variation explained in the data.
The video provides a step-by-step example of calculating R-squared and interpreting its results.
Understanding R-squared allows for better evaluation of the significance and strength of relationships between variables.
Transcripts

5.0 / 5 (0 votes)
Thanks for rating: