How To Make a Simple Frequency Table
TLDRThe video explains how to create a frequency table to analyze a data set. It provides step-by-step guidance on listing the distinct values in the data and their frequencies, then using the completed table to efficiently calculate important statistics like the mean, median, mode and range. Practical examples are shown to demonstrate the process. The video aims to equip viewers with a simple yet powerful tool for organizing data and extracting key metrics, which can aid data analysis and decision making.
Takeaways
- 😀 How to create a frequency table with two columns - one for the values in the dataset, and one for the frequency or count of each value
- 👍 Use the frequency table to easily determine the range by subtracting the lowest value from the highest value
- 🔍 The mode is the value with the highest frequency in the table
- 🤔 A dataset can have more than one mode (bimodal) or just one mode (unimodal)
- 📊 The median is the middle value when the data is arranged in numerical order, which can be determined from the frequency table
- ✅ Use the frequencies to calculate the sum of the values, which is needed to compute the mean
- ➗ Calculate the mean by summing all the values and dividing by the total number of data items
- 📈 Introduced process for confirming median value by eliminating values from both ends until reaching the middle
- 👣 Provided a second example dataset to practice creating a frequency table and calculating statistical measures
- 🎓 Frequency tables allow efficient analysis of datasets to determine range, mode, median, and mean
Q & A
What are the components of a basic frequency table as described in the video?
-A basic frequency table consists of two columns: 'V' for value and 'F' for frequency.
How do you determine the range of a data set using a frequency table?
-The range is calculated by subtracting the lowest value from the highest value in the data set.
What does it mean if a data set is described as 'bimodal'?
-A bimodal data set has two modes, meaning there are two values that occur with the highest frequency.
How can the mode be determined from a frequency table?
-The mode is the value or values in the data set that have the highest frequency.
What changes in the data set's modal classification when an additional '5' is introduced in the example?
-The data set changes from bimodal to unimodal, meaning it goes from having two modes to just one mode.
How is the median determined using a frequency table?
-The median is found by arranging the data in increasing order and identifying the middle number, or by using the frequencies to locate the central value without listing all data points.
What formula is used to calculate the mean from a frequency table?
-The mean is calculated by dividing the sum of all values (value multiplied by its frequency) by the total number of data items.
How is the sum of all numbers in a data set found using a frequency table?
-The sum is found by multiplying each value by its corresponding frequency and then adding up all these products.
In the second example, what is the range of the data set?
-The range is 7, calculated by subtracting the lowest value (2) from the highest value (9).
What is the mean value of the second data set and how is it calculated?
-The mean value is approximately 5.95, calculated by dividing the total sum of the data set (113) by the total number of data items (19).
Outlines
📊 Creating a Frequency Table from a Dataset
The first paragraph explains how to create a two-column frequency table from a dataset. It steps through an example, showing how to list each unique value and count its frequency. This frequency table can then be used to calculate statistical measures like mean, median, mode and range.
😃 Calculating Statistical Measures from a Frequency Table
The second paragraph demonstrates how to use the frequency table to calculate the range, mode, median, and mean. It provides examples for determining each value. The range is found by subtracting the lowest value from the highest value. The mode is the value with the highest frequency. The median is identified by eliminating values symmetrically from both ends to find the middle value. The mean is calculated by multiplying each value by its frequency, summing those products, and dividing by the total number of data items.
📈 Practice Problem for Frequency Table and Statistical Measures
The third paragraph presents a practice problem, providing a new dataset to create a frequency table for. It then steps through calculating the range, mode, median, and mean from this new frequency table. This gives an opportunity to apply the concepts covered in the first two paragraphs.
Mindmap
Keywords
💡frequency table
💡range
💡mode
💡median
💡mean
💡bimodal distribution
💡data set
💡frequency
💡statistics
💡distribution
Highlights
Discussion of using reinforcement learning to optimize dialogue policies in task-oriented dialogue systems.
Explanation of using deep Q-networks and policy gradient methods for dialogue policy optimization.
Description of using user simulators to train dialogue agents and evaluate dialogue policies.
Analysis of challenges in bootstrapping from limited real user data when training task-oriented dialogue agents.
Proposed method of interleaving user simulator training and real user training to improve bootstrapping.
Discussion of evaluating dialogue agents through objective task success metrics and subjective user satisfaction.
Overview of using domain-independent dialogue corpora to pre-train dialogue agents before task-specific fine-tuning.
Description of multi-domain dialogue training by aggregating data across domains.
Analysis of challenges in adapting dialogue agents to new domains with limited in-domain data.
Proposed method of progressive domain adaptation using learned domain representations.
Discussion of limitations of current evaluation metrics and need for more general human evaluations.
Overview of recent trends towards building open-domain conversational dialogue agents.
Description of challenges in maintaining coherent, engaging open-domain conversations.
Proposed future research directions in non-task-oriented conversational dialogue systems.
Conclusion summarizing key points and highlighting importance of natural language research.
Transcripts
Browse More Related Video
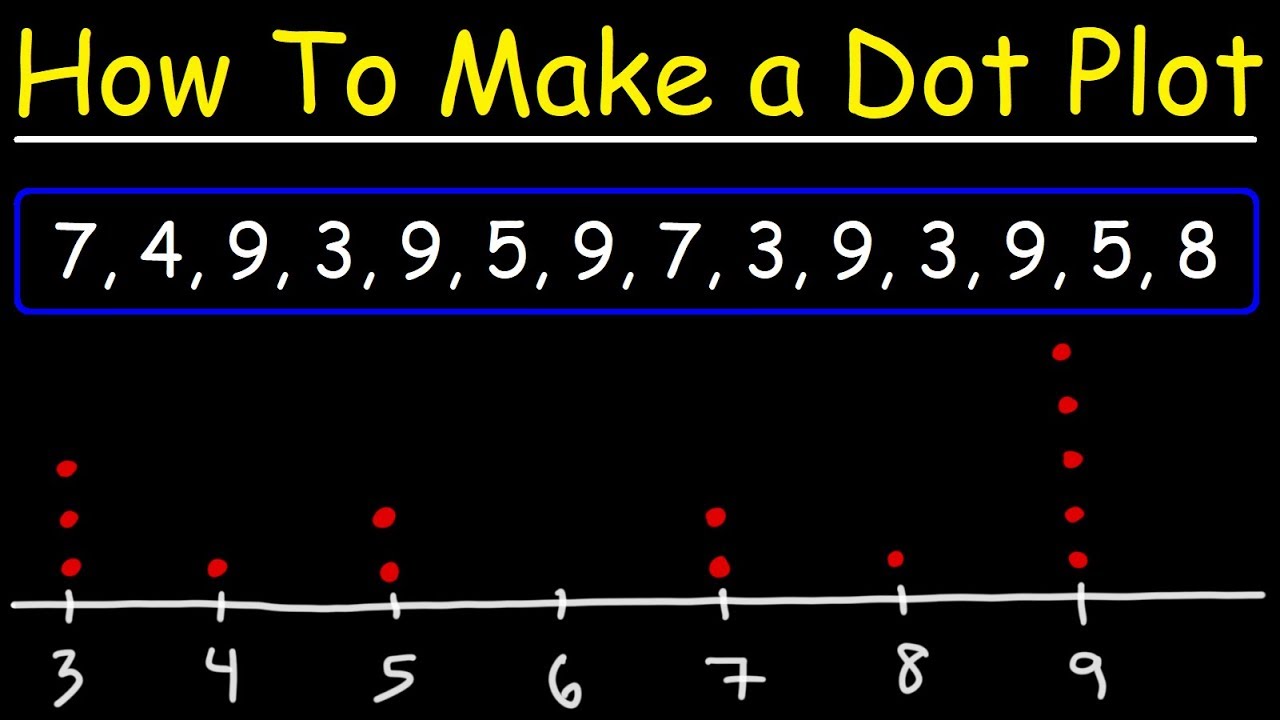
Dot Plots and Frequency Tables
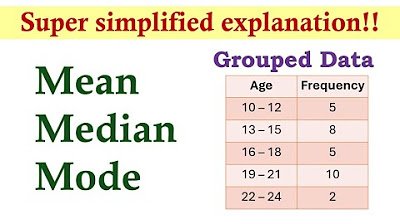
Measures of Central Tendency (Grouped Data) | Basic Statistics
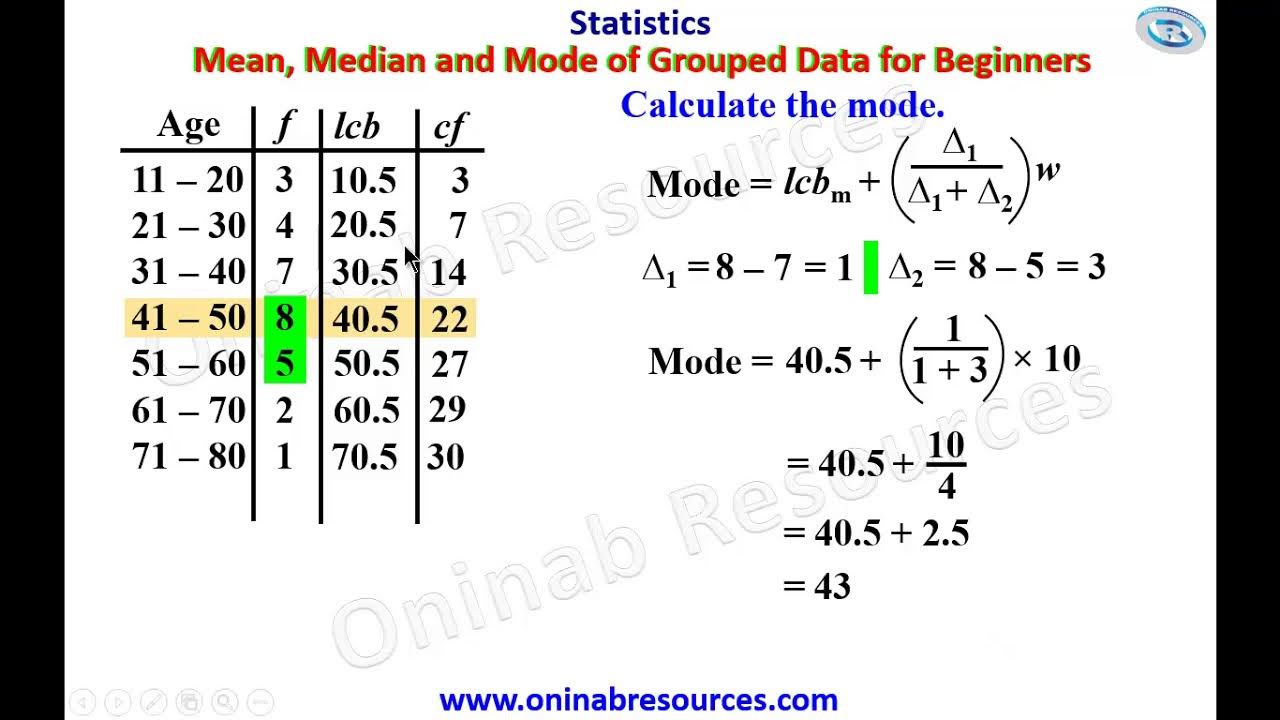
Measure of Central Tendency of Grouped Data for beginners
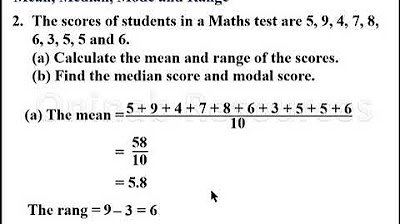
Mean, median, mode of Ungrouped Data
How to Find the Standard Deviation, Variance, Mean, Mode, and Range for any Data Set
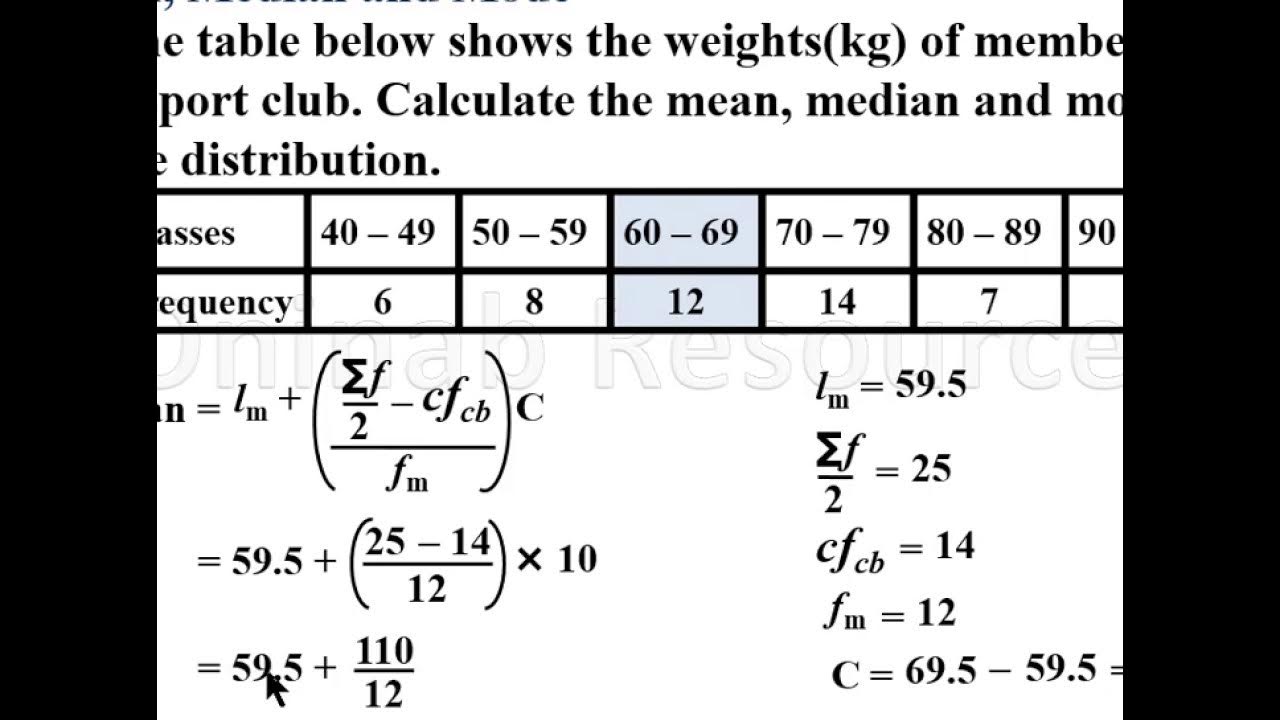
Mean, median and mode of grouped Data(Lesson 1)
5.0 / 5 (0 votes)
Thanks for rating: