Introduction to residuals and least squares regression
TLDRThe video script discusses the exploration of the relationship between height and weight by plotting individual data points on a graph, with height on the X-axis and weight on the Y-axis. It introduces the concept of a regression line, represented as y = mx + b, to approximate the trend observed in the data. The script explains how residuals, the differences between actual and predicted values, are used to assess the fit of the model. It also touches on the concept of least squares regression, a technique to minimize the sum of squared residuals, emphasizing its importance in handling outliers and improving the accuracy of the model.
Takeaways
- 📈 The script discusses the exploration of the relationship between people's height (in inches) and weight (in pounds) through random sampling and data plotting.
- 📊 A scatter plot is used to visualize the data points representing the height-weight combination of individuals, with height on the X-axis and weight on the Y-axis.
- 🔍 An initial observation from the data suggests a roughly linear, positive relationship between height and weight.
- 🟫 The concept of a regression line (y = mx + b) is introduced as a tool to approximate the trend observed in the data.
- 🤔 The process of 'eyeballing' the best fit line is described, highlighting the limitations of manual estimation.
- 📐 The importance of the slope (m) and Y-intercept (b) in the regression line is emphasized for accurately fitting the data points.
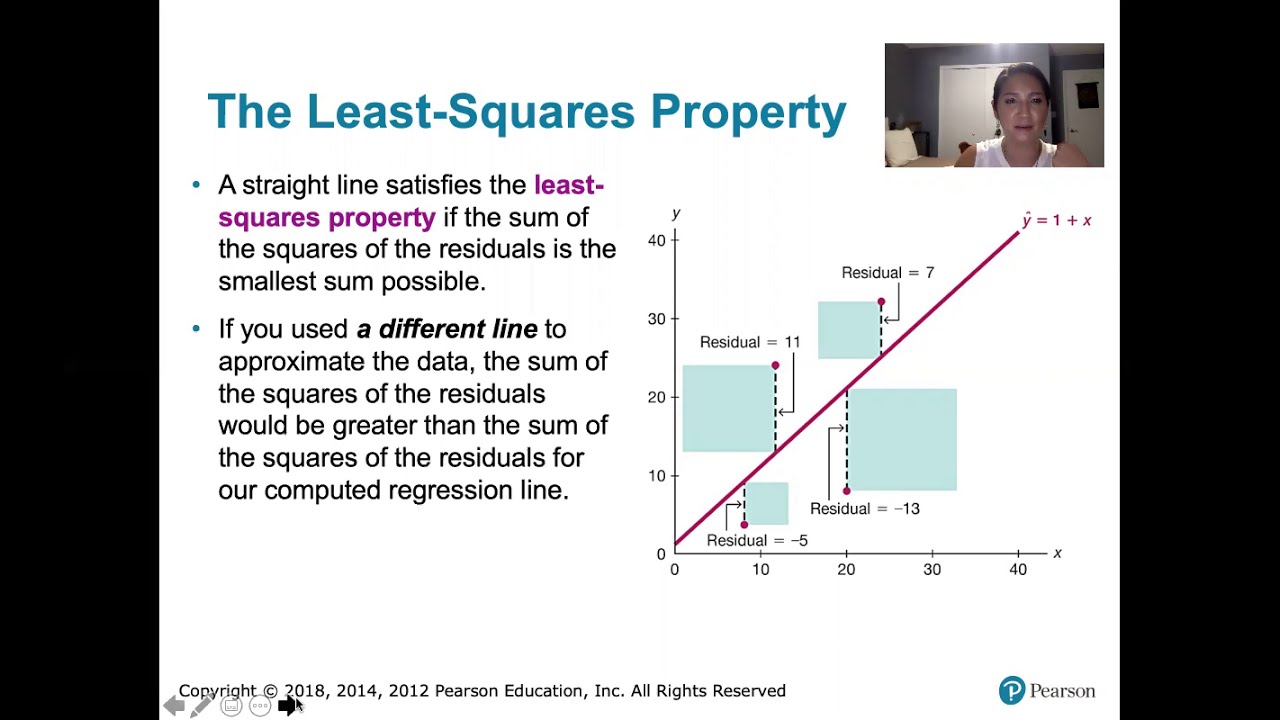
- 🔄 The concept of residuals is introduced, defined as the difference between the actual value and the predicted value by the regression line.
- ⚖️ Residuals can be positive or negative, indicating whether the actual value is above or below the predicted value, respectively.
- 🔢 The idea of minimizing residuals to assess the fit of the regression line is discussed, with the suggestion of using the sum of absolute values or the sum of squares of residuals.
- 🏆 Least squares regression is mentioned as the most typical method used in statistics to find the best-fit line by minimizing the sum of the squares of residuals.
- 🎯 The script emphasizes that least squares regression accounts for significant outliers and gives more weight to larger residuals due to the squaring process.
Q & A
What is the main topic of the video?
-The main topic of the video is the exploration of the relationship between people's height and weight, and the concept of linear regression in analyzing this relationship.
How does the narrator measure the relationship between height and weight?
-The narrator measures the relationship by randomly sampling people, recording their heights in inches and weights in pounds, and plotting these as points on a graph with height on the X-axis and weight on the Y-axis.
What does the narrator observe about the relationship between height and weight?
-The narrator observes a roughly linear, positive relationship between height and weight, where as height increases, weight tends to increase as well.
What is the term used to describe the line that the narrator tries to fit to the data points?
-The term used to describe this line is 'regression line', which can be represented by the equation y = mx + b, where m is the slope and b is the Y-intercept.
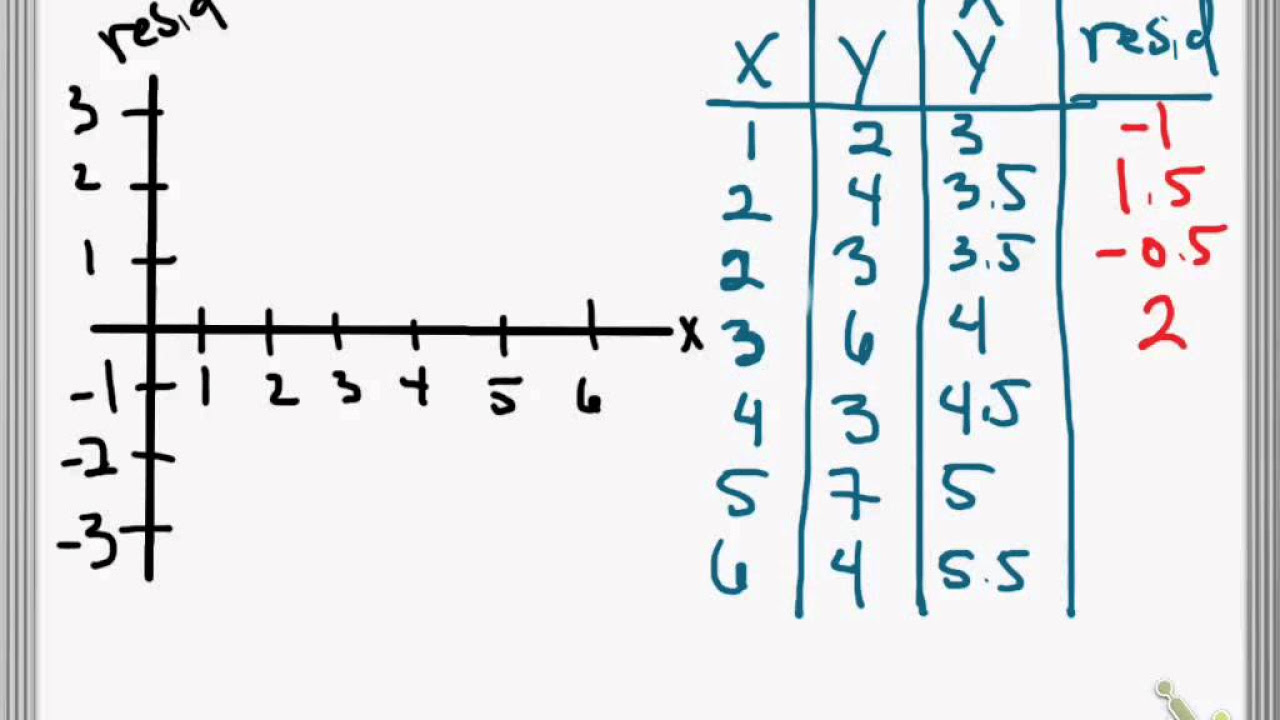
What is a residual in the context of this video?
-A residual is the difference between the actual value of a data point and the value predicted by the regression line for a given height.
Why might simply adding up all residuals not be an effective way to minimize the error in a regression line?
-Simply adding up all residuals can be ineffective because positive and negative residuals can cancel each other out, potentially leading to a sum of zero, which does not accurately represent the overall fit of the model to the data points.
What alternative method is suggested for creating a regression line?
-The alternative method suggested is to minimize the sum of the squares of the residuals, which is a technique known as least squares regression. This method gives larger weights to larger residuals, helping to better fit the model to the data points.
What is the significance of squaring the residuals when minimizing the error?
-Squaring the residuals ensures that all residuals are positive, regardless of their original sign. This makes it easier to combine them and avoids the issue of positive and negative residuals canceling each other out. Additionally, it gives more emphasis to larger residuals, which can significantly impact the fit of the model.
What will be covered in future videos according to the narrator?
-In future videos, the narrator plans to cover the calculation of residuals and derive the formula for determining the slope (m) and Y-intercept (b) of a line that minimizes the sum of the squares of the residuals.
How does the least squares regression method help in dealing with outliers?
-The least squares regression method helps by giving more weight to outliers, as their squared residuals will be larger and thus have a greater impact on the total sum of squares. This helps the model to fit the data more accurately, even when there are significant outliers present.
What is the role of the slope (m) and Y-intercept (b) in the regression line?
-The slope (m) and Y-intercept (b) in the regression line are crucial parameters that define the line's position and angle. The slope indicates how much the Y variable (weight) changes for each unit change in the X variable (height), while the Y-intercept represents the estimated weight when the height is zero.
Outlines
📈 Exploring the Relationship Between Height and Weight
The narrator begins by expressing an interest in understanding the correlation between people's height in inches and their weight in pounds. To explore this, they randomly sample individuals, measure their heights and weights, and plot these measurements as points on a graph. The height is represented along the X-axis and weight along the Y-axis. The data suggests a roughly linear, positive relationship, indicating that as height increases, so does weight. The narrator attempts to draw a regression line that approximates this trend, explaining that this line represents the model y = mx + b, where m is the slope and b is the Y-intercept. However, they acknowledge that this line won't pass through all the points due to individual differences, leading to the concept of residuals - the difference between the actual value and the predicted value from the model. The narrator illustrates how to calculate a residual using the example of a person who is 60 inches tall and weighs 100 pounds.
📊 Minimizing Residuals in Regression Analysis
The paragraph delves into the concept of residuals further, discussing how they measure the fit of the regression line to the data points. The narrator explains that simply adding up the residuals can be misleading due to positive and negative values canceling each other out. Instead, they introduce the method of minimizing the sum of absolute values of residuals as a more effective approach. The most common technique, however, is minimizing the sum of the squares of the residuals, which is less sensitive to the sign of the residual and gives more weight to larger deviations from the model. This technique is known as least squares regression and will be covered in more detail in future videos, including how to calculate the slope (m) and intercept (b) of the line that minimizes the sum of squared residuals.
Mindmap
Keywords
💡Random Sampling
💡Data Points
💡Regression Line
💡Slope (m)
💡Y-Intercept (b)
💡Residuals
💡Least Squares Regression
💡Linear Relationship
💡X-axis and Y-axis
💡Eyeballing
💡Outliers
Highlights
Exploring the relationship between height and weight by randomly sampling people and plotting their height-weight combinations.
Using the X-axis to represent height in inches and the Y-axis for weight in pounds.
Observing a roughly linear, positive relationship between height and weight.
The concept of a regression line as an approximation of the trend in data points.
The equation of a regression line, y = mx + b, where m is the slope and b is the Y-intercept.
Understanding residuals as the difference between the actual value and the predicted value by the model.
The importance of minimizing residuals to improve the fit of the regression line.
The method of least squares regression for finding the best-fit line by minimizing the sum of squares of residuals.
Least squares regression's ability to account for significant outliers and its weighting of larger residuals.
The process of eyeballing a line through the data points to approximate the trend.
The concept of residuals being either positive or negative, depending on whether the actual value is above or below the predicted value.
The method of summing absolute values of residuals as an initial approach to minimize the overall difference.
The rationale behind squaring residuals to make them all positive and give more weight to larger residuals.
The potential for future videos to delve into calculating residuals and deriving the formula for the line that minimizes the sum of squares of residuals.
The practical application of this analysis in understanding human physical attributes and their correlations.
The foundational concepts introduced in the transcript as a stepping stone for more advanced statistical methods and analysis.
Transcripts
Browse More Related Video


5.0 / 5 (0 votes)
Thanks for rating: