Linear Regression, Clearly Explained!!!
TLDRThe video script introduces linear regression, a statistical method to model relationships between variables. It explains the process of fitting a line to data using least squares, calculating R-squared to measure the model's goodness of fit, and determining the reliability of the model through p-value calculation. The example of mouse weight predicting size illustrates these concepts, emphasizing the importance of both R-squared and p-value in assessing the significance of the relationship.
Takeaways
- 🚀 Linear regression is a powerful statistical tool used to fit a line to data points and understand relationships.
- 📈 The process begins with using least squares to fit a line to the data, minimizing the sum of the distances (residuals) from the data points to the line.
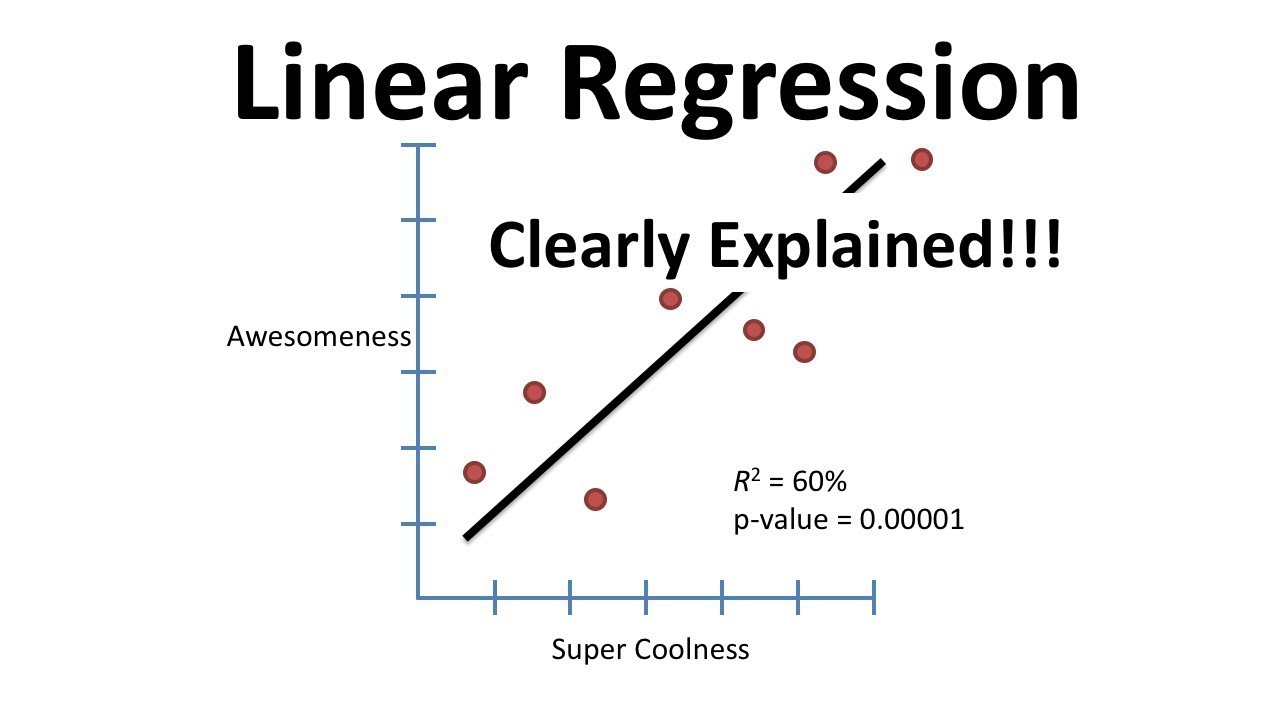
- 🔄 Calculating R-squared is essential as it measures the proportion of the variance in the dependent variable that's explained by the independent variables in the model.
- 📊 A high R-squared value indicates a better fit of the model to the data, showing that a larger percentage of variation is explained by the model.
- 🎯 The p-value is used to determine the statistical significance of the R-squared value, ensuring the relationship is not due to random chance.
- 🔢 The F-distribution is used to calculate the p-value for R-squared, comparing the variance explained by the model to the unexplained variance.
- 🔍 A low p-value (typically less than 0.05) suggests that the observed R-squared is unlikely to have occurred by chance, indicating a reliable relationship.
- 🛠️ Linear regression models can be extended to include multiple independent variables, allowing for more complex relationships to be explored.
- 📊 When multiple variables are involved, adjusted R-squared is used to account for the number of parameters in the model, providing a more accurate measure of the model's explanatory power.
- 🧠 Understanding the concepts of sum of squares, degrees of freedom, and F-distribution is crucial for interpreting the results of linear regression analyses.
- 🔍 Linear regression is widely applicable across various fields, from predicting mouse size based on weight in genetics to countless other scenarios.
- 🚀 The journey through understanding linear regression helps build a strong foundation for more advanced statistical analyses and data interpretation.
Q & A
What is the main topic of the video?
-The main topic of the video is linear regression, also known as General Linear Models, and its key concepts such as least squares, R-squared, and p-values.
How does the least squares method work in linear regression?
-The least squares method works by fitting a line to the data points in such a way that the sum of the squares of the residuals (distances from the line to the data points) is minimized.
What is R-squared in the context of linear regression?
-R-squared is a statistical measure that represents the proportion of the variance in the dependent variable that is predictable from the independent variable(s). It is calculated as 1 minus the ratio of the variance around the fit to the variance around the mean.
What is the significance of calculating a p-value for R-squared?
-Calculating a p-value for R-squared helps to determine if the observed relationship between variables is statistically significant or if it could be attributed to random chance. A small p-value indicates that the relationship is likely significant.
How is the F distribution used in calculating the p-value for R-squared?
-The F distribution is used to generate a range of possible F values by comparing the variance explained by the model to the variance unexplained by the model. The p-value is then determined by comparing the observed F value from the data to this distribution.
What is the role of the degrees of freedom in the context of linear regression?
-Degrees of freedom are used to adjust the sums of squares into variances, which are then used in calculating R-squared and the F value. They depend on the number of parameters in the model and the sample size.
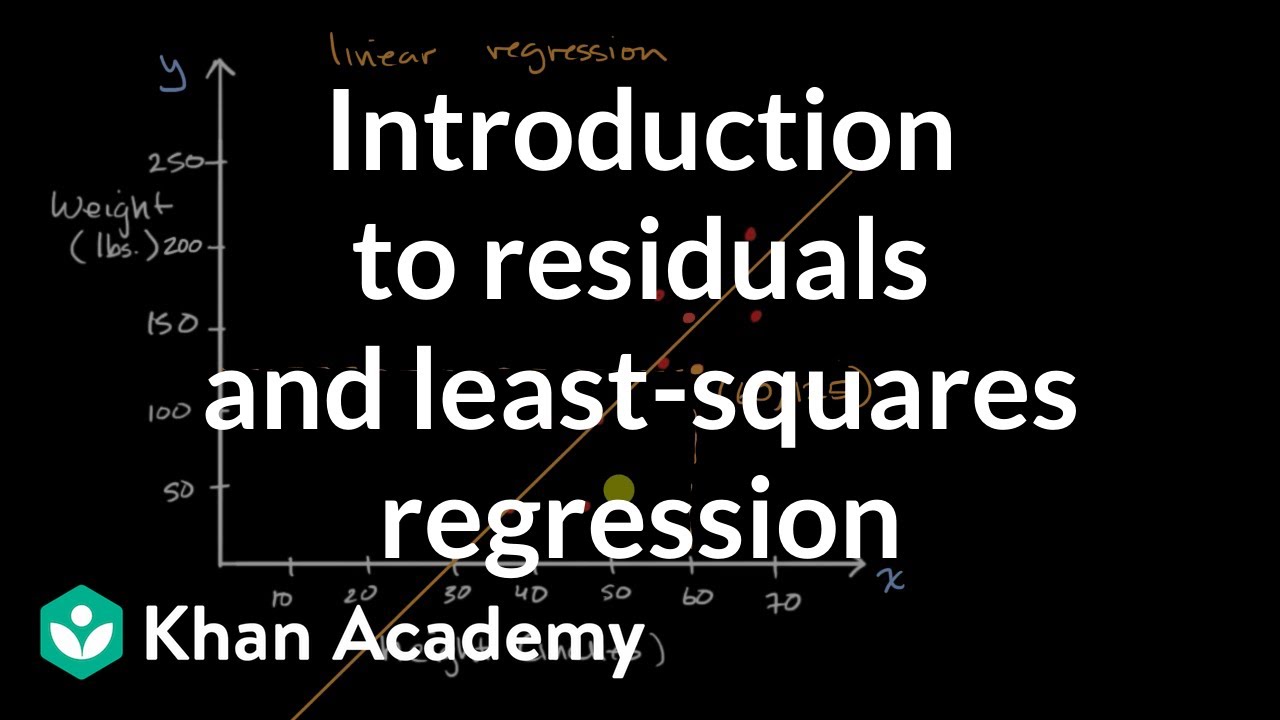
How does the concept of residuals relate to linear regression?
-Residuals are the differences between the observed values of the dependent variable and the values predicted by the regression line. They are used to assess the fit of the model and to calculate R-squared.
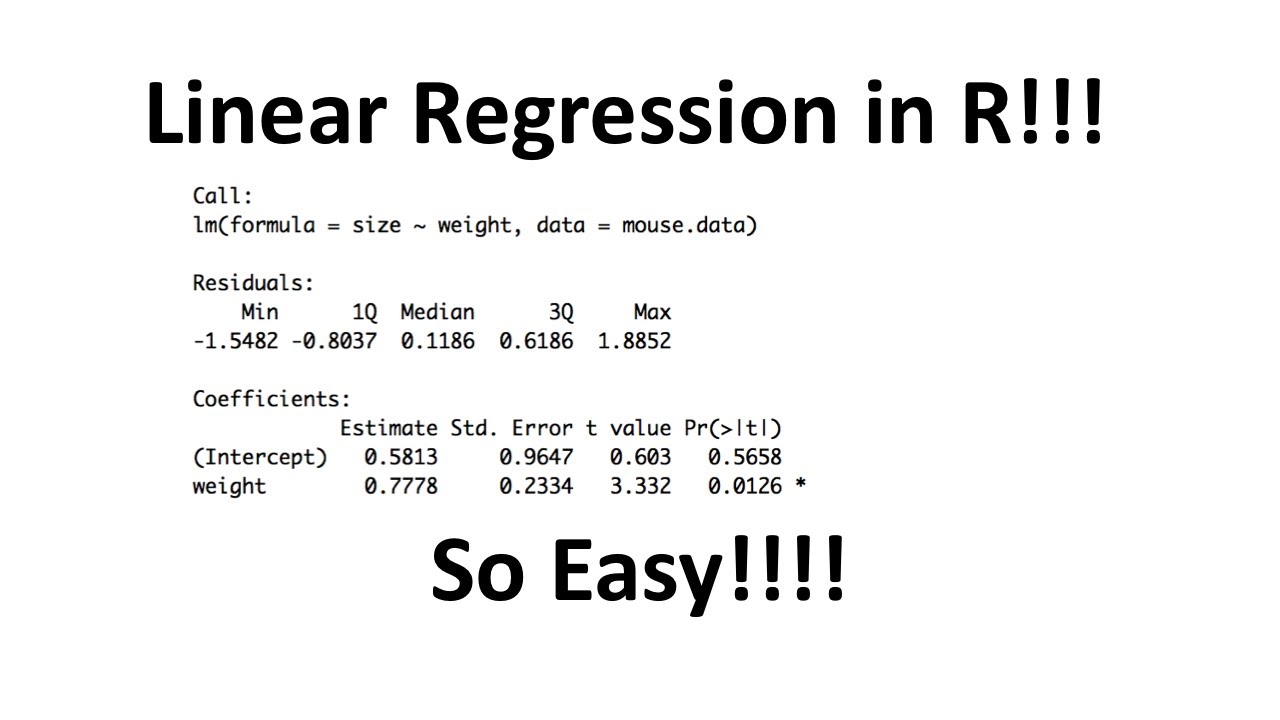
What is an example of a simple linear regression model?
-An example of a simple linear regression model is one where the size of mice is predicted based on their weight, represented by the equation y = β0 + β1x, where y is the size, x is the weight, β0 is the y-intercept, and β1 is the slope.
What is the purpose of the adjusted R-squared value?
-The adjusted R-squared value adjusts the R-squared for the number of parameters in the model, providing a more accurate measure of the model's explanatory power by penalizing for the addition of unnecessary parameters.
How can you determine if a variable is useful in predicting the outcome in a regression model?
-You can determine if a variable is useful by observing if its inclusion in the model significantly reduces the sum of squares around the fit, which would be reflected in an increase in R-squared and a significant p-value for the F test.
What is the significance of a high R-squared value with a low p-value in linear regression?
-A high R-squared value with a low p-value indicates that a large proportion of the variance in the dependent variable can be explained by the independent variables in the model and that this relationship is statistically significant, suggesting a reliable prediction model.
Outlines
🚢 Introduction to Linear Regression
This paragraph introduces the topic of linear regression, emphasizing its importance as a statistical tool. It outlines the primary steps involved in linear regression: fitting a line to data using least squares, calculating R-squared, and determining a p-value for R-squared. The explanation is grounded in the context of a boat journey, symbolizing an adventure into the world of statistics. The paragraph also mentions the role of the genetics department at the University of North Carolina at Chapel Hill in bringing this educational content to the audience.
📊 Least Squares and Residuals
This section delves into the method of least squares, a technique used to fit a line to a set of data points. It explains the concept of residuals, which are the distances from the data points to the fitted line. The process of rotating the line to minimize the sum of squared residuals is described, leading to the line that best fits the data. This paragraph also introduces new terminology and provides a review of related concepts, setting the stage for a deeper understanding of linear regression.
📈 Calculating R-Squared and Variance
This paragraph focuses on the calculation of R-squared, a statistical measure that represents the proportion of the variance for a dependent variable that's explained by an independent variable or variables in a regression model. It explains the concept of variance around the mean and the fit, and how these are used to calculate R-squared. The paragraph uses the example of mouse weight and size to illustrate how R-squared quantifies the amount of variation in mouse size that can be explained by mouse weight. It also introduces the concept of sum of squares and its role in calculating R-squared.
🤔 Interpreting R-Squared Values
This section discusses the interpretation of R-squared values in different scenarios. It explains how R-squared can range from 0 to 1, with higher values indicating a better fit of the model to the data. The paragraph provides examples where mouse weight can perfectly predict mouse size, have no predictive power, or have a mixed effect. It emphasizes that R-squared is a measure of how much variance in the dependent variable is explained by the independent variables and how it can be applied to any equation, regardless of complexity.
🔄 Understanding Degrees of Freedom and F-Statistics
This paragraph introduces the concepts of degrees of freedom and F-statistics in the context of linear regression. It explains how degrees of freedom are related to the number of parameters in the fit and the mean line, and how they influence the calculation of F-statistics. The paragraph describes the process of calculating F-statistics by comparing the variance explained by the model to the unexplained variance. It also touches on the idea of adjusting R-squared for the number of parameters, hinting at the adjusted R-squared value that will be discussed in the following paragraphs.
🎯 Calculating and Interpreting P-Values
This section explains the process of calculating a p-value for R-squared, which is used to determine the statistical significance of the relationship between variables in a regression model. It describes the concept of F-distribution and how it is used to generate a p-value by comparing the observed F-statistic to a theoretical distribution. The paragraph also discusses the importance of p-values in assessing the reliability of the relationship quantified by R-squared, and how a small p-value indicates that the observed relationship is unlikely to have occurred by chance.
🎉 Recap and Conclusion
In this concluding paragraph, the video script recaps the main ideas discussed throughout the session. It emphasizes the importance of linear regression in quantifying relationships in data and the role of R-squared and p-values in evaluating the strength and significance of these relationships. The paragraph invites viewers to engage with the content by subscribing to the channel and suggesting ideas for future videos, highlighting the interactive and educational nature of the Stat Quest series.
Mindmap
Keywords
💡Linear Regression
💡Least Squares
💡R-Squared
💡Residuals
💡P-Value
💡Variance
💡Fitting a Line to Data
💡Sum of Squares
💡General Linear Models
💡Statistical Significance
💡Degrees of Freedom
Highlights
Introduction to linear regression and its importance in understanding data relationships.
Explanation of least squares method for fitting a line to data points.
Calculation of R-squared to measure the goodness of fit of the linear model.
Understanding residuals and their role in linear regression analysis.
The process of rotating the line to minimize the sum of squared residuals.
Introduction of new terminology related to linear regression.
Use of mouse weight to predict mouse size as an example dataset.
Explanation of how to calculate the sum of squares around the mean (SSM).
Definition and calculation of the sum of squares around the fit (SSF)
The concept of variance and its relevance to linear regression.
Formula for R-squared and its interpretation in explaining data variation.
Examples of R-squared values and their implications on data explanation.
Introduction to the concept of adjusted R-squared for multiple regression.
Explanation of p-value calculation for R-squared and its significance.
The role of degrees of freedom in transforming sums of squares into variances.
The process of calculating the F-statistic and its relation to the p-value.
Use of random data sets to approximate the distribution of F-statistics.
Interpretation of the p-value in the context of linear regression analysis.
Summary of the key concepts of linear regression, R-squared, and p-value.
Invitation to subscribe for more content and engagement with the topic.
Transcripts
Browse More Related Video


5.0 / 5 (0 votes)
Thanks for rating: