Scales of Measurement - Nominal, Ordinal, Interval, & Ratio Scale Data
TLDRThis video tutorial delves into the four primary scales of measurement in statistics, offering insights into how data can be quantified and categorized. It begins with nominal scale data, emphasizing its qualitative, categorical nature without inherent numerical value or order. Next, it explores ordinal scale data, where order matters but differences aren't measurable. The video then transitions to interval scale data, highlighting that differences are quantifiable, yet it lacks a true zero point, making ratio comparisons inapplicable. Finally, ratio scale data is discussed, noted for its measurable differences, meaningful ratios, and a true zero point, providing a comprehensive foundation for understanding statistical data measurement.
Takeaways
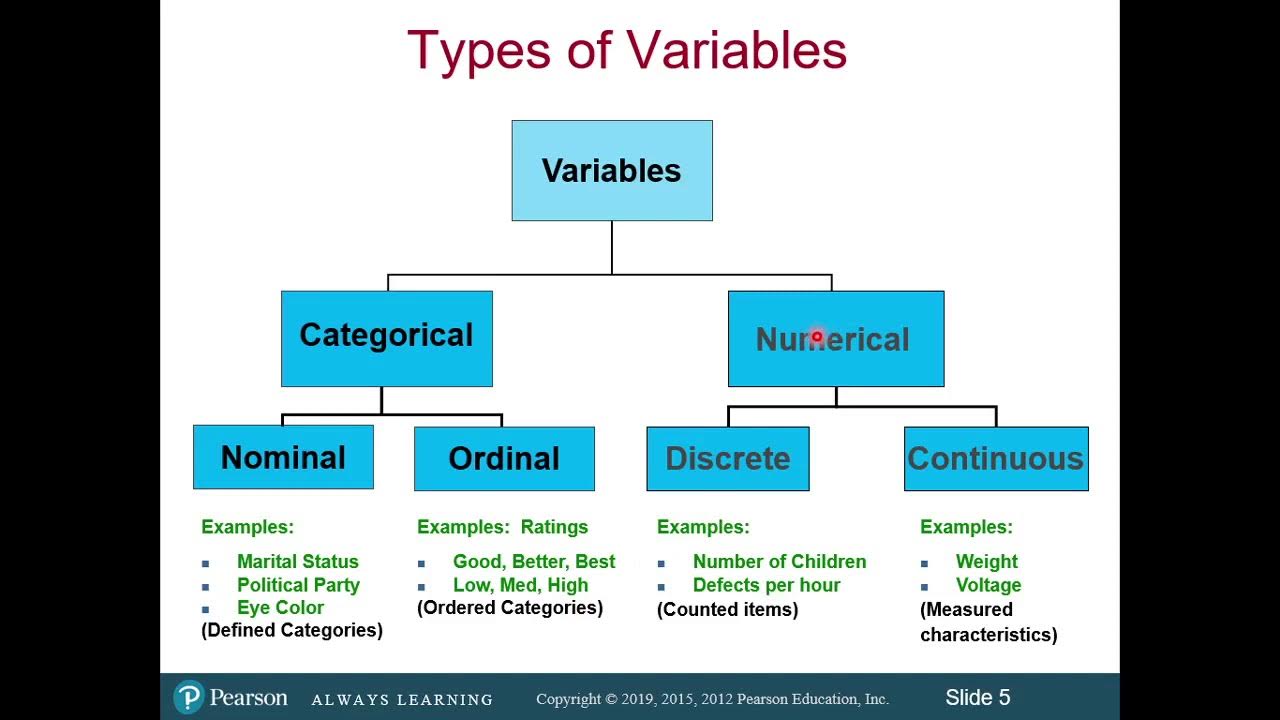
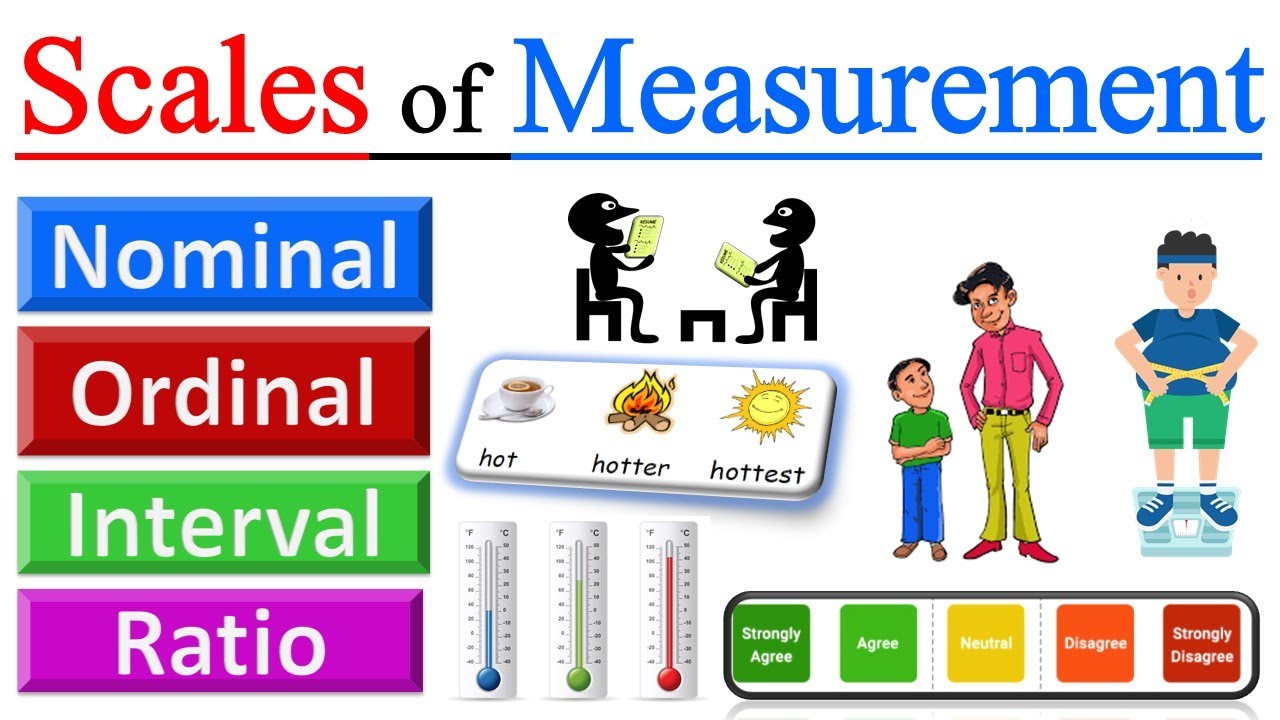
- 😃 There are 4 main types of measurement scales: nominal, ordinal, interval and ratio
- 😊 Nominal scales use labels and categories, order doesn't matter
- 🔢 Ordinal scales rank data, but differences between ranks can't be measured
- 📏 Interval scales have measurable differences, but no true zero point
- ⏱ Ratio scales have measurable differences and a true zero starting point
- 📊 Nominal data can be used to calculate percentages and proportions
- ❓Only interval and ratio scales allow measuring differences between data points
- 🧮 Only ratio scales allow calculating meaningful ratios between data points
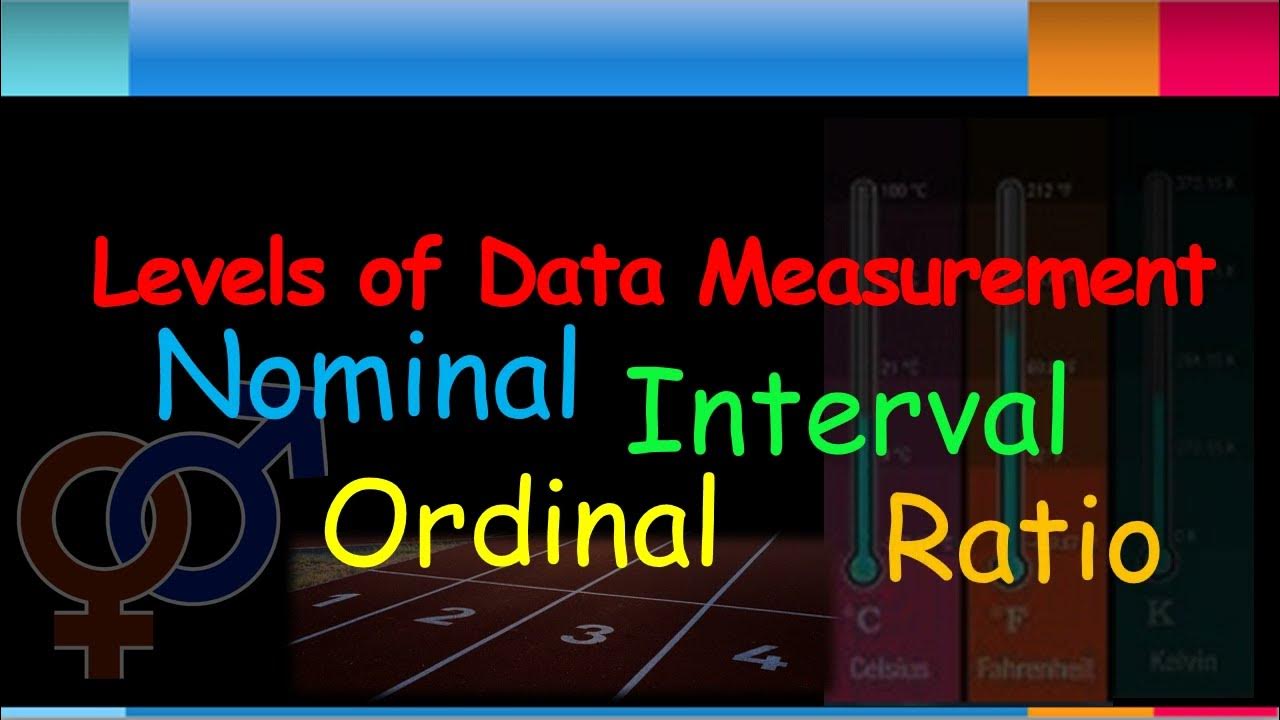
- 🌡 Temperature data is an example of interval scale measurement
- 📝 Exam grades are an example of ratio scale measurement
Q & A
What are the four main scales of measurement discussed in the video?
-The four main scales of measurement discussed are: nominal, ordinal, interval, and ratio.
What type of data does the nominal scale measure?
-The nominal scale measures qualitative, categorical data such as names, colors, labels that do not have a numerical value.
Does order matter for nominal scale data?
-No, order does not matter for nominal scale data. The categories can be arranged in any way.
What scale of data could be used to measure placements in a race?
-An ordinal scale is typically used to rank placements in a race, such as 1st place, 2nd place, and 3rd place.
Can you measure ratios with interval scale data like temperature?
-No, you cannot measure ratios with interval scale data. For example, 60 degrees Fahrenheit is not twice as hot as 30 degrees.
Does interval scale data have an absolute zero starting point?
-No. Interval scale data like temperature in Fahrenheit or Celsius allows for negative values, so there is no absolute zero point.
What features define ratio scale data?
-Ratio scale data has a meaningful order, differences and ratios are measurable, and it has a true zero starting point.
Can nominal scale data be used in calculations?
-Nominal data itself cannot be used in calculations, but you can calculate statistics based on people's responses to nominal categories in surveys.
Why can’t you measure differences for ordinal scale data?
-You can’t measure precise differences for ordinal data because the differences between ranked positions may not be equal.
Does a grade of 0 have meaning as ratio scale data?
-Yes, a 0 grade means a student got nothing right on the test, which is meaningful as the absolute lowest possible score.
Outlines
📝 Overview of Nominal Scale Data
The first paragraph provides an introduction to nominal scale data. It explains that this is a qualitative form of measurement focused on categorical labels rather than quantitative values. The order of the categories does not matter. Examples are provided, like assigning numbers to colors, where the order is arbitrary. Limitations are noted - nominal data cannot be used directly in calculations, but responses to the categories can be calculated, like percentages for color preferences in a survey.
📈 Characteristics of Ordinal Scale Data
The second paragraph discusses ordinal scale data, which is used to rank items where order matters but differences cannot be precisely measured. Examples are provided like race finishes and ranking experiences. Values can be assigned but the differences between adjacent ranks are not equal. Ordinal scale allows ordering but not precise quantification of differences.
🚸 Key Aspects of Interval Scale Data
The third paragraph examines interval scale data. It explains that differences can be measured, like temperature in degrees Fahrenheit or Celsius, but ratios cannot be taken. There is no true zero point. Examples are given to show that intervals have measurable distances but lack meaningful ratios. Order also matters, with temperature showing natural progression. Overall, interval scale enables quantification of differences but not ratios.
📐 Features of Ratio Scale Data
The fourth paragraph looks at ratio scale data. It has all the features - order, measurable differences, meaningful ratios, and a true zero starting point. Grades are used as an example, showing ratios make sense, like one score being 3 times another. Unlike interval scale, ratio scale supports both difference and ratio comparisons, grounded by a true zero.
Mindmap
Keywords
💡Nominal scale
💡Ordinal scale
💡Interval scale
💡Ratio scale
💡Qualitative data
💡Quantitative data
💡Order
💡Differences
💡Ratios
💡True zero point
Highlights
The study found that climate change will have significant impacts on health, agriculture and economies.
Higher temperatures lead to more heat-related illnesses, expanded ranges of disease vectors like mosquitos, and food insecurity.
The researchers used advanced modeling techniques to project different climate scenarios out to 2100.
Mitigation efforts to reduce emissions could limit global warming to around 2°C and avoid the most severe impacts.
Adaptation measures like public health initiatives, infrastructure updates, and shifting agricultural practices will also be critical.
Poorer tropical regions will be among the hardest hit due to economic constraints on adaptation capabilities.
Even under moderate warming scenarios, global GDP will likely face losses of 3-6% by 2100 compared to a world without climate change.
Crop yields are projected to decline in many regions, especially the tropics, leading to higher food prices and increased risk of hunger.
Heat stroke hospitalizations could rise dramatically in some areas, straining health systems.
Malaria and dengue fever could spread to new regions as the climate warms.
Coastal flooding from rising seas and extreme weather events will likely displace millions of people.
The transition to clean energy, disaster readiness, and sustainable agriculture are key adaptation priorities.
Deep emissions cuts are needed soon to avoid mounting impacts that may be irreversible.
The costs of inaction far outweigh the costs of mitigation and adaptation measures.
Urgent action is required to build climate resilience and ensure vulnerable groups get support.
Transcripts
Browse More Related Video
Classification of Variables and Types of Measurement Scales
Scales of Measurement - Nominal, Ordinal, Interval, Ratio (Part 2) - Introductory Statistics

Nominal, Ordinal, Interval & Ratio Data: Simple Explanation With Examples
Introduction to Levels of Measurement: Nominal, Ordinal, Interval, Ratio
Data Types - Levels of Data Measurements - Nominal Ordinal Interval Ratio | Statistics | Research
Scales of Measurement in Statistics - Nominal, Ordinal, Interval, Ratio | Level of Measurement
5.0 / 5 (0 votes)
Thanks for rating: