How To Make a Relative Frequency Distribution Table
TLDRThe script explains the process of creating a relative frequency distribution table from a dataset. It first lists out all the values in the dataset and counts the frequency or occurrences of each value. It then sums the frequencies to get the total frequency. Relative frequency is calculated by dividing each value's frequency by the total frequency. The sums of the relative frequencies should equal 1 to check the work. The video encourages viewers to subscribe and watch a follow up video on cumulative relative frequency to build on the concepts covered here regarding statistics.
Takeaways
- 😀 The goal is to make a relative frequency distribution table from a dataset.
- 👉 First list the values and frequencies of each value in the dataset.
- 📊 Calculate relative frequency by dividing each frequency by the total frequency.
- 🧮 Add up the relative frequencies to check your work - it should equal 1.
- 📈 Start with the lowest value and move to the highest to fill in the table.
- 😎 Subscribe to the channel and click the notification bell for more videos.
- 🔢 There are examples with the numbers: 2, 3, 4, 5, 7, 8.
- 📊 The video explains how to create the frequency and relative frequency columns.
- ✏️ You can test your work by making sure the relative frequencies add up to 1.
- 🤓 There is a follow up video on cumulative relative frequency to build on this concept.
Q & A
What are the steps to make a relative frequency distribution table?
-The steps are: 1) List out all the values in the dataset. 2) Count the frequency of each value. 3) Sum the frequencies. 4) Calculate the relative frequency by dividing each frequency by the total frequency.
How do you calculate relative frequency?
-To calculate relative frequency, take the frequency of a value and divide it by the total frequency.
What is the purpose of a relative frequency distribution?
-A relative frequency distribution shows the proportion of data that belongs to each class. It allows you to compare frequencies across different datasets.
What is the difference between frequency and relative frequency?
-Frequency is the count of each value. Relative frequency is the frequency divided by the total count, which gives the proportion.
Why should the relative frequencies add up to 1?
-The relative frequencies add up to 1 because they represent the proportional values out of the whole dataset. The total of all proportions equals 1.
How can you check if you calculated relative frequency correctly?
-Add up all the relative frequencies. If the total equals 1, then the calculations are correct.
What is cumulative relative frequency?
-Cumulative relative frequency is the sum of the relative frequencies up to and including a given value. It shows the proportion of data below a certain point.
How is a frequency table constructed?
-A frequency table has columns for the data values, frequencies, and relative frequencies. The values are listed from lowest to highest.
What is the first step in making a relative frequency table?
-The first step is to list out all the values in the dataset and count the frequency or occurrences of each one.
Why are relative frequency tables useful?
-Relative frequency tables allow you to see the distribution of data. They make it easy to visualize patterns and compare frequencies across datasets.
Outlines
😀 Creating a frequency distribution table
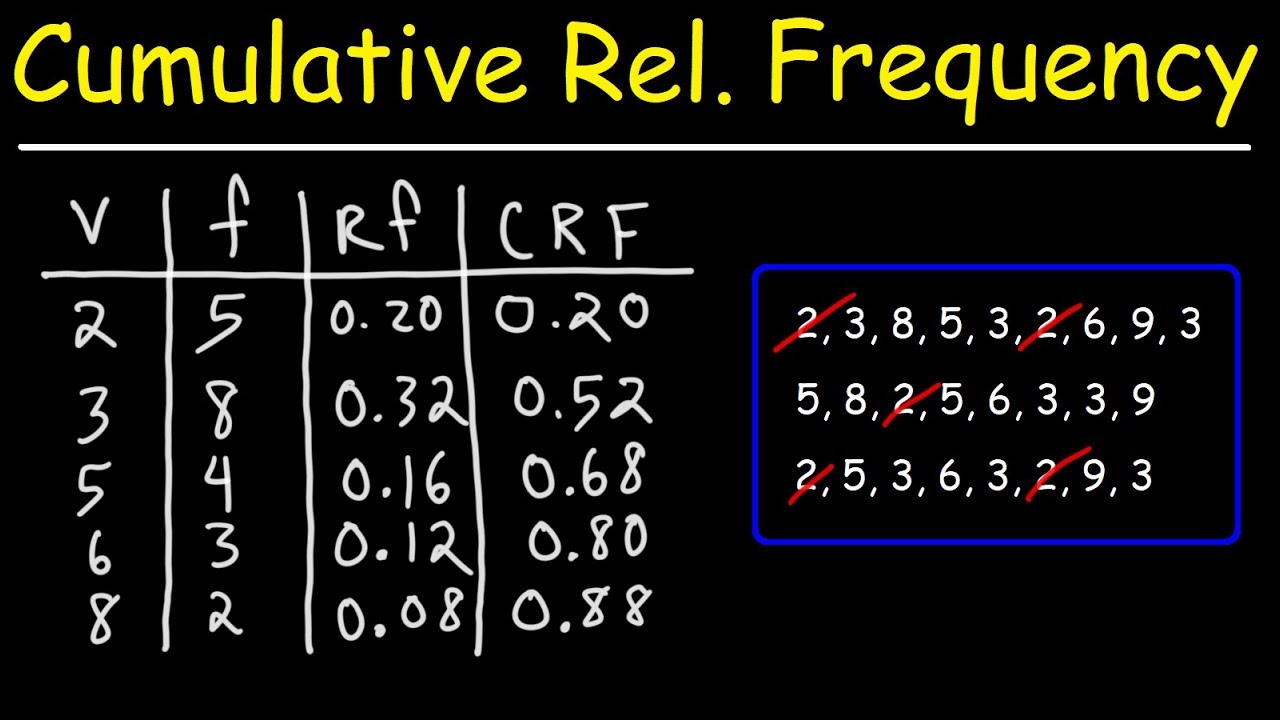
This paragraph explains how to create a frequency distribution table from a dataset. It goes through an example dataset, listing out the values and counting the frequencies for each unique value. It then calculates the total frequency by summing the individual frequencies. The relative frequency is calculated by dividing each frequency by the total frequency.
😃 Calculating and checking relative frequencies
This paragraph continues the example, walking through calculating the relative frequencies for each value by dividing the frequencies by the total frequency. It explains that the relative frequencies should sum to 1, providing a way to double check that the calculations were done correctly.
Mindmap
Keywords
💡frequency
💡relative frequency
💡distribution
💡table
💡data set
💡value
💡total frequency
💡pattern
💡notification bell
💡cumulative relative frequency
Highlights
The study found a significant increase in test scores for students who participated in the new education program.
Researchers developed a novel technique to isolate compounds from plant extracts.
The results showed a strong correlation between socioeconomic status and health outcomes.
Dr. Lee proposed an innovative framework to integrate machine learning into clinical diagnostic systems.
The experiment rejected the null hypothesis and supported the alternative hypothesis.
This study provides important evidence for the effects of meditation on reducing anxiety.
The mathematicians proved the long-standing conjecture using a clever new approach.
The climate data revealed alarming trends in sea level rise over the past decade.
The theoretical model enabled more accurate predictions of molecular interactions.
The researchers identified a genetic mutation associated with increased cancer risk.
The survey results shed light on changing attitudes towards renewable energy sources.
The study provides evidence that exercise improves cognitive function in older adults.
Dr. Ahmed developed a new therapy that shows promise for treating drug-resistant infections.
This discovery challenges long-held assumptions about the evolution of early mammals.
The team designed a robot capable of navigating challenging terrain with unprecedented agility.
Transcripts
Browse More Related Video
How To Make a Cumulative Relative Frequency Table

Elementary Statistics - Chapter 2 - Exploring Data with Tables & Graphs
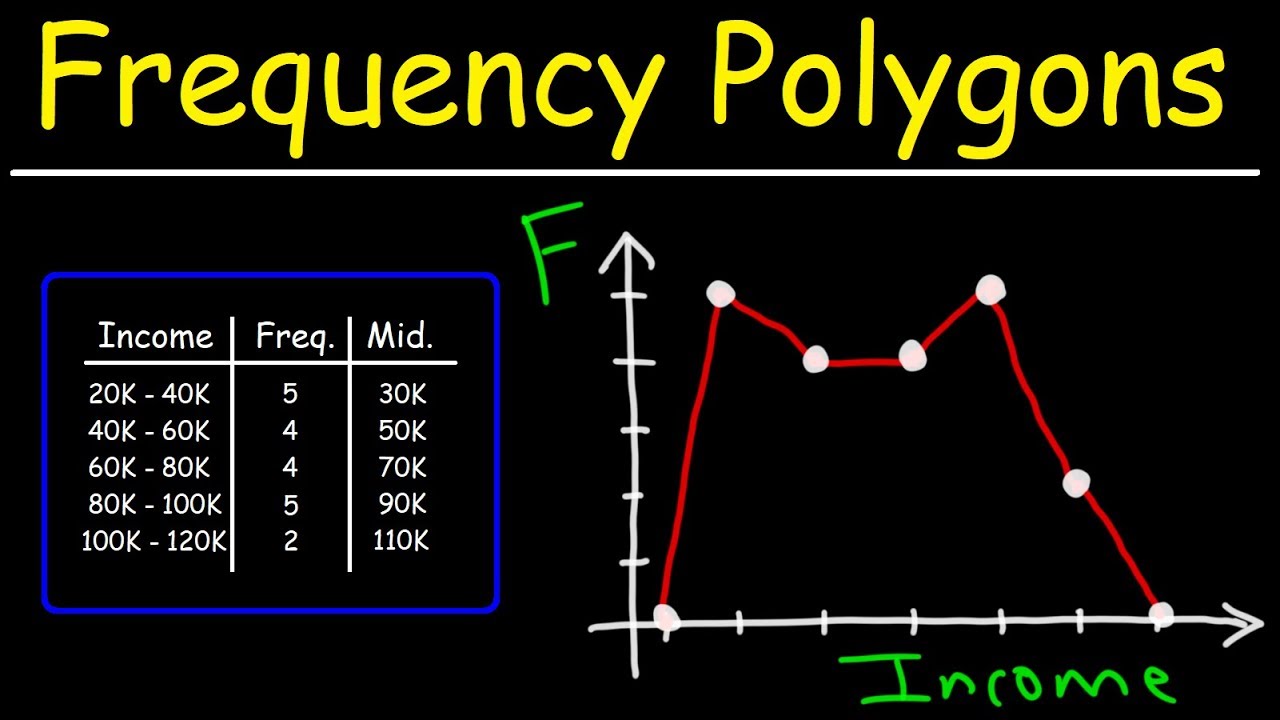
How To Make a Frequency Polygon

Mean, Median, and Mode of Grouped Data & Frequency Distribution Tables Statistics
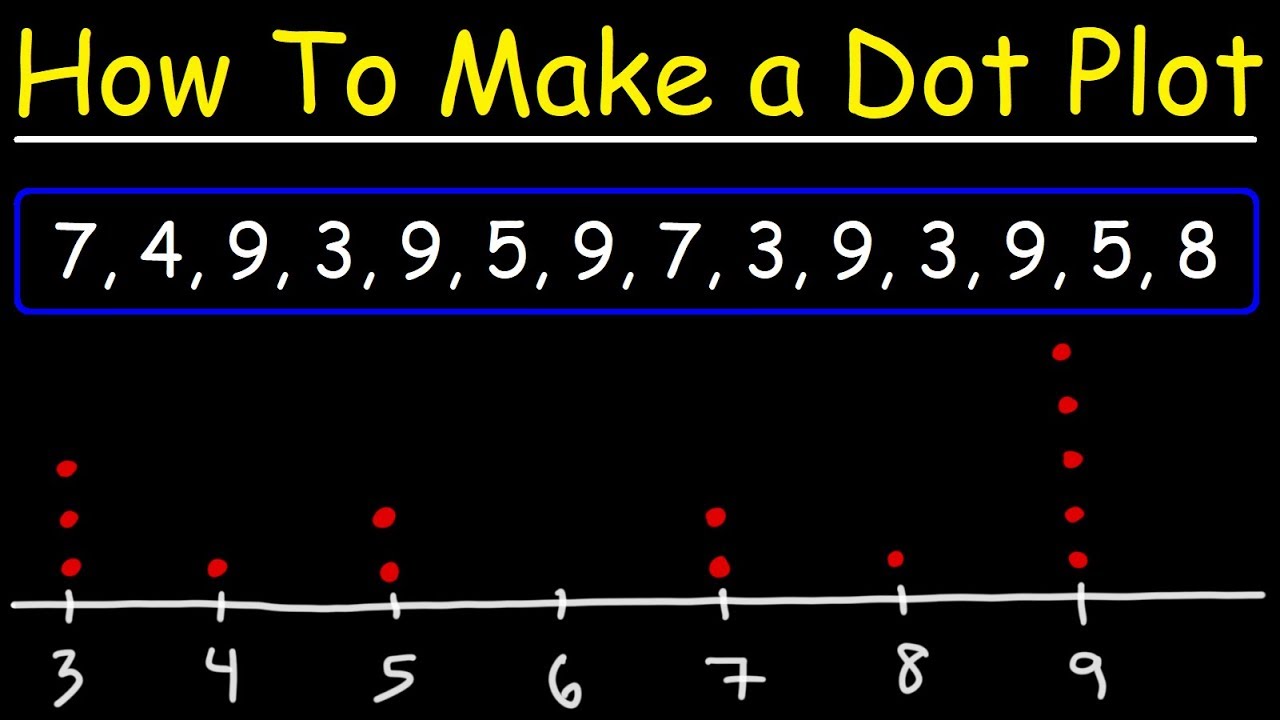
Dot Plots and Frequency Tables

The Maths Prof: Frequency Tables (Mean, Median, Mode & Range)
5.0 / 5 (0 votes)
Thanks for rating: