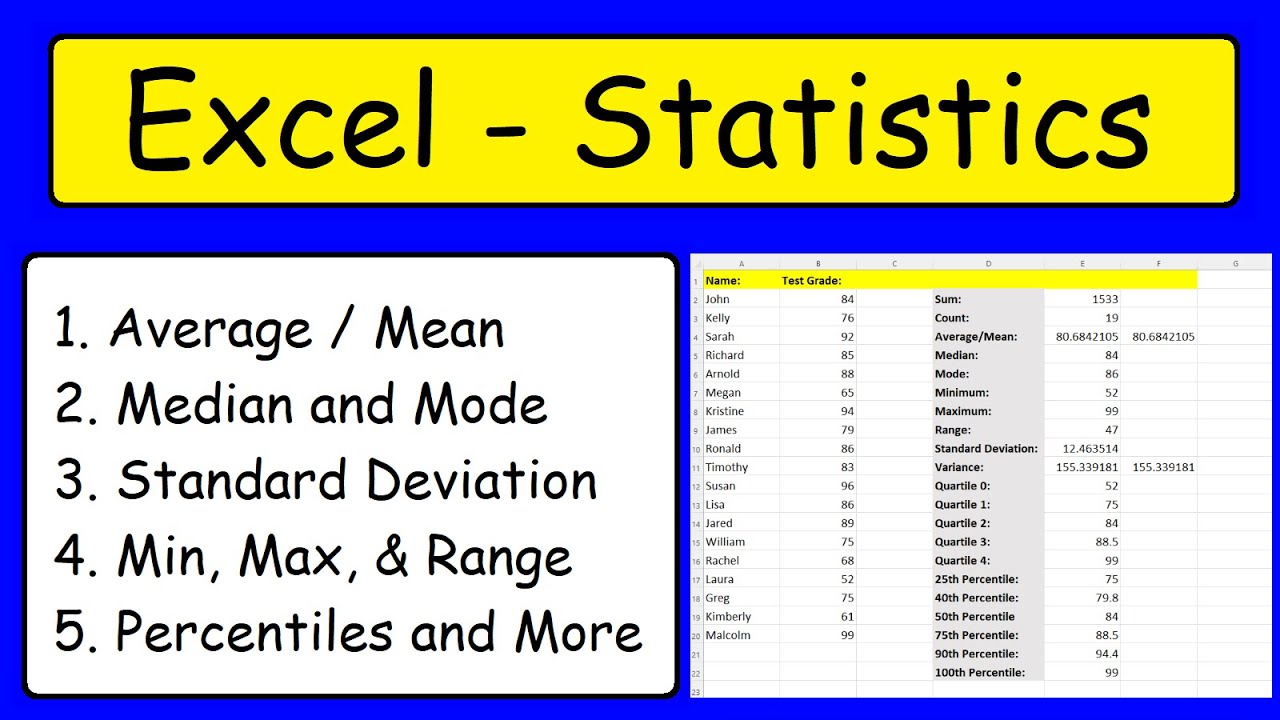
Calculating The Standard Deviation, Mean, Median, Mode, Range, & Variance Using Excel
TLDRThis video explains how to use Excel to calculate statistical measures for a set of numbers, including the mean, median, mode, standard deviation, variance, and range. It shows how to use Excel functions like AVERAGE, MEDIAN, MODE, STDEV, VAR, MAX, and MIN to easily perform these calculations. It also covers manually calculating the median and shows the formulas for sample and population standard deviation and variance. Overall, it demonstrates using Excel as an efficient tool to analyze and describe the central tendency and spread of numerical data sets.
Takeaways
- 😀 The video explains how to calculate statistical measures like mean, median, mode, standard deviation, range, and variance in Excel.
- 📊 You can use Excel functions like AVERAGE, MEDIAN, MODE, STDEV, MAX, and MIN to easily calculate these statistical measures.
- 🧮 The mean is calculated by summing all the numbers and dividing by the count.
- 📏 The median is the middle number when the data is sorted.
- 📈 The mode is the number that appears most frequently.
- 📉 Standard deviation measures how dispersed the data is from the mean.
- 🚩 The range is the difference between the maximum and minimum values.
- ♨️ Variance is the square of the standard deviation.
- 📊 You can use the sample or population versions of standard deviation and variance in Excel.
- 🙌 You don't need to put data in separate cells to calculate these measures in Excel.
Q & A
How can you calculate the mean in Excel?
-To calculate the mean in Excel, you can use the AVERAGE function. Highlight the set of numbers and apply the AVERAGE function to get the mean.
What is the formula for calculating the mean manually?
-The formula for calculating the mean manually is: Mean = Sum of all values / Total number of values.
How do you find the median in Excel?
-To find the median in Excel, first arrange the numbers in order. Then use the MEDIAN function and highlight the dataset to get the median value.
How do you determine the median when there are two middle values?
-When there are two middle values, the median is calculated by taking the average of those two middle values.
What does mode refer to in a dataset?
-The mode refers to the number that occurs most frequently in a dataset. It is the value with the highest frequency.
How do you find the range in Excel?
-The range is calculated by taking the difference between the maximum and minimum values. Use the MAX and MIN functions to find these values and subtract to get the range.
What is the difference between sample and population standard deviation?
-The sample standard deviation uses n-1 in the formula denominator while population standard deviation uses n. Sample standard deviation tends to be slightly larger.
How can you calculate variance from standard deviation?
-Variance can be calculated by squaring the standard deviation value. Sample variance = (Sample standard deviation)^2.
What is the difference between sample and population variance?
-Sample variance uses n-1 while population variance uses n in the formula. Sample variance also uses the sample standard deviation in its formula.
How can Excel be used to quickly calculate statistical measures?
-Excel has built-in functions like AVERAGE, MEDIAN, MODE, MAX, MIN, STDEV.S, STDEV.P, VAR.S, and VAR.P that can calculate statistical measures with just one formula.
Outlines
📊 Calculating Statistical Measures in Excel
This segment introduces viewers to calculating basic statistical measures such as the mean, median, mode, range, and standard deviation using Excel. Initially, it demonstrates how to find the total of a set of numbers using the SUM function. For calculating the mean, it advises using the AVERAGE function instead of a non-existent 'mean' function, illustrating both column-based and single-cell input methods. It explains how to determine the number of data points using the COUNT function. The median is calculated both manually, through an elimination process when numbers are listed in ascending order, and using Excel's MEDIAN function. It concludes with identifying the mode by frequency of appearance, utilizing Excel's MODE function.
🔢 Advanced Statistical Functions in Excel
The second paragraph expands on more complex statistical calculations in Excel, covering the maximum, minimum, range, sample and population standard deviation, and variance. It starts with finding the maximum and minimum values using MAX and MIN functions. Then, it explains how to calculate the range as the difference between these two values. For standard deviation, it distinguishes between the sample (STDEV.S) and population (STDEV.P) calculations, providing a formula for each. Similarly, it differentiates between sample variance (VAR.S) and population variance (VAR.P), showing how to calculate these and how variance relates to standard deviation squared.
🧮 Variance and Standard Deviation Calculations
The final segment focuses on detailed variance and standard deviation calculations, illustrating how to convert standard deviation values into variance by squaring them. It specifically shows how to raise the standard deviation of a sample and population to the power of two to obtain the sample and population variance, respectively. This section consolidates the viewer's understanding of variance calculation from standard deviation, emphasizing Excel's capability to simplify these statistical computations.
Mindmap
Keywords
💡Mean
💡Median
💡Mode
💡Standard Deviation
💡Variance
💡Range
💡Excel Functions
💡Data Points
💡Summation
💡Frequency
Highlights
Proposed a novel method for detecting financial fraud using machine learning.
Developed an algorithm to optimize supply chain management, reducing costs by 15%.
Presented insights into consumer behavior and psychology through analysis of social media data.
Demonstrated innovative techniques for training neural networks to achieve state-of-the-art accuracy on image classification tasks.
Introduced a theoretical framework for understanding the evolution of cooperation in multi-agent systems.
Proposed novel methods for distilling knowledge from large language models into smaller, more efficient models.
Developed a new technique for personalized recommender systems using graph neural networks.
Presented an analysis of gender bias in word embeddings and methods for mitigation.
Demonstrated a system for real-time language translation achieving new benchmarks in accuracy.
Introduced an innovative approach for few-shot learning, enabling models to learn from limited data.
Proposed novel generative models for text and images based on transformer architectures.
Presented mathematical proofs establishing bounds on the generalization error of deep neural networks.
Developed techniques to improve model robustness against adversarial examples.
Introduced methods for interpretable machine learning, enabling explanation of model predictions.
Proposed an approach for privacy-preserving federated learning in a decentralized network.
Transcripts
Browse More Related Video

Statistics: Standard deviation | Descriptive statistics | Probability and Statistics | Khan Academy

Mode, Median, Mean, Range, and Standard Deviation (1.3)
Statistics - Excel

Math 119 Chapter 3 part 2
Elementary Statistics - Chapter 3 Describing Exploring Comparing Data Measure of Central Tendency
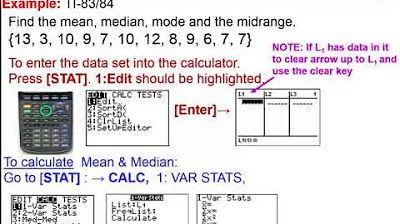
TI-84 Plus: Find the Mean, Median, and Mode
5.0 / 5 (0 votes)
Thanks for rating: