How To Find The Weighted Mean and Weighted Average In Statistics
TLDRThe video explains how to calculate weighted means and averages. It provides examples of finding the weighted mean of a data set, calculating a class's average test score using weights, and determining the average student weight using percentages as weights. It then demonstrates how to calculate a student's final grade and GPA using category weights. Finally, it shows how to find the concentration of a combined antifreeze solution using the volumes of the solutions as weights in the weighted average formula.
Takeaways
- 😀 The weighted mean calculates an average by accounting for the frequency or weight of each data point
- 📊 To calculate a weighted mean: multiply each data point by its weight, sum the products, then divide by the sum of the weights
- 🎓 Weight can refer to frequency, percentage, or any measure of relative importance per data point
- 💡 Weighted means help account for unequal representation across data points
- 🚀 Apply weighted mean to calculate overall class grades using category grades and weights
- 🔢 Use the weighted mean formula: Σwi xi / Σwi where xi is a data point and wi is its weight
- 📈 A data point with a larger weight impacts the weighted mean more than a point with a smaller weight
- 🔭 When mixing solutions, the resulting concentration tends closer to that of the solution with greater volume
- ✏️ To find a missing data point in a weighted mean, solve the equation for the unknown variable
- 🧮 Weighted means have applications in statistics, business, education, finance, science and more
Q & A
What is the formula used to calculate a weighted mean?
-The formula is: Sum of (Weight x Value) / Sum of Weights
Why would you calculate a weighted mean instead of a regular arithmetic mean?
-A weighted mean accounts for the different frequencies or weights of the data values. It provides a more accurate average in cases where the data points do not occur with equal frequency.
How do you determine if the weighted mean will be closer to the lower or higher data values?
-It will be closer to the value that has the higher weight or frequency associated with it.
What do the weights represent in the grade calculation examples?
-The weights represent the percentage that each category (homework, exams, etc.) contributes towards the final grade.
Why did John score higher than Kelly despite her better performance on some assessments?
-John performed better on tests and finals which had a higher weight or percentage contribution to the final grade.
What is represented by x and w in the antifreeze example?
-x represents the concentrations of the solutions and w represents the volumes.
Why is the new antifreeze concentration closer to 50% than 20%?
-Because the 50% solution had a larger volume (weight) so it contributed more to the final mixed concentration.
What are grade points in the GPA calculation?
-Grade points are the numerical values assigned to letter grades (A=4, B=3, C=2, etc.)
What are credit hours in the context of GPA?
-Credit hours refer to the number of credits assigned to a course based on its instructional hours.
How is a weighted average concentration calculated?
-It is calculated by multiplying the concentrations by the volumes, summing the results, and dividing by the total volume.
Outlines
😀 Calculating Weighted Mean
This paragraph explains how to calculate the weighted mean of a sample of numbers. It provides an example of calculating the weighted mean of 10 numbers by multiplying each number's value by its frequency, summing those products, and dividing by the sum of the frequencies.
😀 Weighted Mean Formula
This paragraph provides another example of calculating a weighted mean, this time for a class of students with different average test scores. It shows how to apply the formula for weighted mean, summing the products of weights and values then dividing by the sum of weights.
😀 Average Weight Calculation
This paragraph involves calculating the average weight for a group of college students given percentages of students at different average weights. It demonstrates using percentages as weights in the weighted mean formula.
😀 Calculating Final Grades
This paragraph works through an example of calculating final semester grades for two students based on weighted percentages for different course components. It explains how category weights impact final grades.
😀 Grade Point Average Calculation
This paragraph shows how to calculate a student's GPA given course credit hours and letter grades. It assigns point values for grades and uses credit hours as weights in the weighted mean formula.
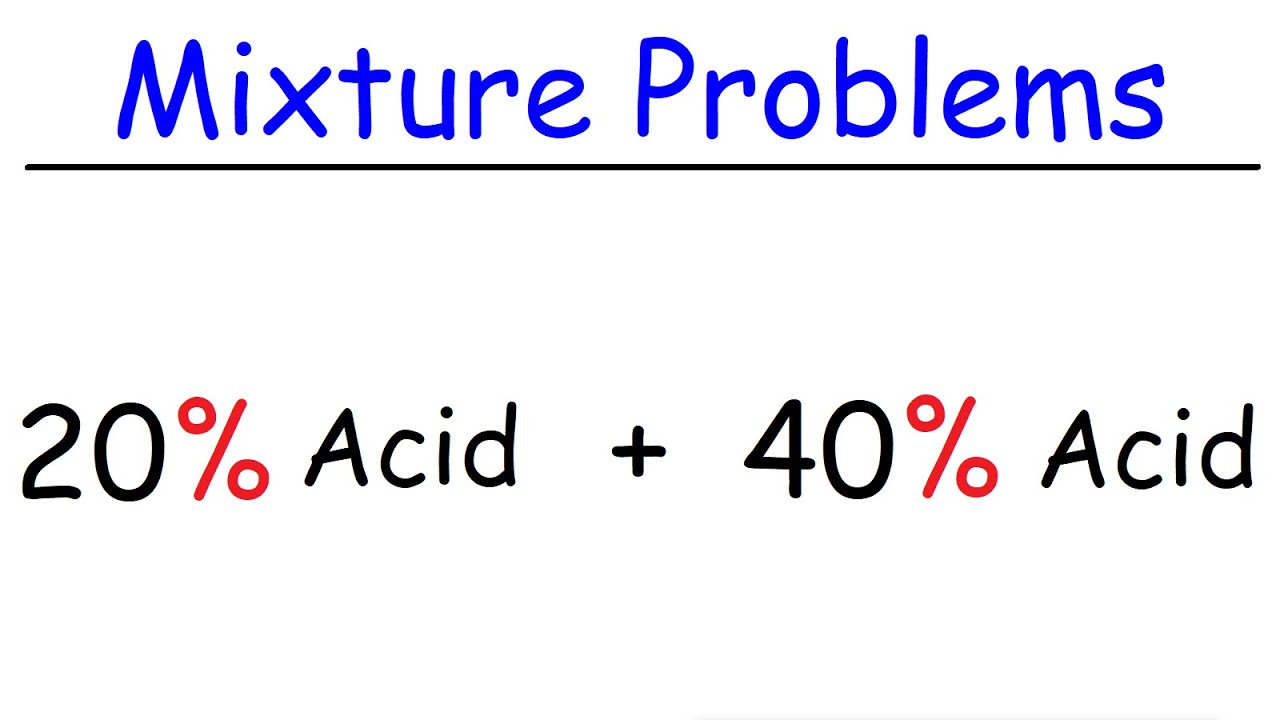
😀 Concentration of Mixed Solutions
This paragraph involves mixing solutions of two different concentrations and volumes. It explains how the volume of each solution determines its weight in calculating the weighted mean concentration of the mixture.
Mindmap
Keywords
💡weighted mean
💡sample mean
💡frequency
💡percentage
💡weight
💡credit hours
💡grade points
💡concentration
💡volume
💡GPA
Highlights
The author proposes a new theoretical framework for understanding human decision making.
A key finding is that emotional factors play a central role in decision making, even in seemingly rational choices.
The study provides empirical evidence that challenges traditional economic models based solely on utility maximization.
The experimental results demonstrate that individuals frequently make decisions that violate the axioms of expected utility theory.
The author argues that integrating emotion into decision models allows for more accurate predictions of real-world choice behaviors.
A novel emotion-integrated decision making model is proposed that shows strong alignment with behavioral data.
The proposed model provides new insights into irrational decision biases like the framing effect and loss aversion.
Understanding the emotional drivers behind decisions could inform the design of social and economic policies.
The research highlights the need for interdisciplinary integration of psychology, neuroscience, and economics.
Brain imaging findings reveal distinct neural correlates of emotional influences versus utility calculations.
The work opens promising new research directions at the intersection of emotion theory and behavioral economics.
Practical applications could include improving financial and medical decision making under emotional stress.
Limitations include small sample sizes and the need to replicate findings in broader contexts.
Overall, this research makes important theoretical and empirical contributions to understanding the role of emotion in human choice behavior.
The novel decision making model proposed provides a strong foundation to build upon in future interdisciplinary work.
Transcripts


5.0 / 5 (0 votes)
Thanks for rating: