R-squared, Clearly Explained!!!
TLDRThe video script introduces R-squared as a metric of correlation that is intuitive to interpret and easier to calculate than the standard 'r'. It explains how R-squared represents the percentage of variation explained by the relationship between two variables. The script uses examples to illustrate the calculation and interpretation of R-squared, emphasizing its advantages over 'r' in understanding the strength of correlation. It concludes by highlighting the ease of converting 'r' to R-squared for better comprehension.
Takeaways
- 📊 R-squared is a metric of correlation that is easy to compute and interpret.
- 🔄 R-squared is similar to the correlation coefficient 'r', but offers easier interpretation.
- 🎯 A correlation value close to 1 or -1 indicates a strong relationship between two variables, while a value near 0 indicates a weak relationship.
- 📈 R-squared represents the proportion of the variance for the dependent variable that's explained by the independent variable(s).
- 🤔 R-squared is calculated by dividing the variance explained by the model by the total variance.
- 🏋️♂️ An example in the script involves predicting mouse weight based on size, demonstrating how R-squared can quantify the fit of a model.
- 🔢 When comparing R-squared values, a higher R-squared indicates a better fit of the model to the data.
- 🔄 R-squared can be calculated for any linear relationship, not just in the context of predicting weight from size.
- 📐 The script also discusses comparing two potentially uncorrelated variables, such as 'time spent sniffing a rock' and mouse weight.
- 🔢 R-squared can be converted from 'r' by squaring the correlation coefficient, providing a clearer picture of how much variance is explained.
- 🚀 The video concludes by encouraging viewers to apply their understanding of R-squared to better interpret statistical relationships in future studies.
Q & A
What is the main topic of the video?
-The main topic of the video is R-squared, a metric of correlation that is easy to compute and interpret.
How is R-squared related to the standard correlation metric 'r'?
-R-squared is the square of 'r', making it easier to interpret the strength of the relationship between two variables.
What does an R-squared value close to 1 indicate?
-An R-squared value close to 1 indicates a strong relationship between two variables, meaning a high percentage of the variation is explained by the relationship.
How does the video demonstrate the calculation of R-squared?
-The video demonstrates the calculation of R-squared by comparing the variation around the mean to the variation around a fitted line, using the sum of squared differences.
What is the significance of R-squared in predicting outcomes?
-R-squared indicates how well a line or model fits the data, allowing for better predictions of outcomes based on the relationship between variables.
Why is R-squared preferred over the correlation coefficient 'r' for some people?
-R-squared is preferred because it provides a percentage that directly represents the proportion of variation explained by the relationship, making it more intuitive to interpret.
What does a low R-squared value, such as 0.01, tell us about the relationship between variables?
-A low R-squared value, like 0.01, indicates that only 1% of the variation in the data is explained by the relationship, suggesting that other factors may be more influential.
How can R-squared help in comparing the fit of different models?
-By comparing the R-squared values of different models, we can determine which model explains more of the variation in the data and thus has a better fit.
What is the role of R-squared in statistical significance?
-A statistically significant R-squared value indicates that the observed relationship between variables is unlikely to be due to chance and that the model has a meaningful explanatory power.
How does the direction of correlation affect the interpretation of R-squared?
-R-squared itself does not indicate the direction of the correlation. However, if the direction is not obvious from the context, it can be mentioned that the variables are positively or negatively correlated along with the R-squared value.
What is the key takeaway from the video about R-squared?
-The key takeaway is that R-squared represents the percentage of variation in data that is explained by the relationship between two variables, and it is a more intuitive measure than the correlation coefficient 'r'.
Outlines
📊 Introduction to R-squared and its Comparison to Correlation 'r'
This paragraph introduces the concept of R-squared as a metric of correlation that is both easy to compute and intuitive to interpret. It contrasts R-squared with the standard metric 'r' for correlation, highlighting that while 'r' values close to 1 or -1 indicate a strong relationship between two variables, values close to zero are less desirable. The video aims to explain why R-squared is beneficial, especially in its ease of interpretation, using an example where R-squared equals 0.7 is 1.4 times better than R-squared equals 0.5. It also begins to illustrate the calculation of R-squared through an example of plotting mouse weight against mouse identification numbers, emphasizing the importance of ordering data and the mean in understanding variation.
🧮 Calculation and Interpretation of R-squared with Examples
This paragraph delves into the step-by-step calculation and interpretation of R-squared. It uses a specific example to demonstrate how to calculate the variation around the mean and the variation around a fitted line (the blue line). By comparing these variations, the paragraph shows how R-squared quantifies the improvement in fitting the data with a line rather than just using the mean. The example concludes with an R-squared value of 0.81 or 81%, indicating that the size-weight relationship explains 81% of the total variation in the data. Another example with unrelated variables (mouse weight and time spent sniffing a rock) results in an R-squared of 0.06 or 6%, showing a much weaker relationship. The paragraph also explains the relationship between R-squared and 'r', where R-squared is the square of 'r', and how this squared value enhances interpretability.
🔢 Final Thoughts on R-squared and its Utility in Statistical Analysis
The final paragraph wraps up the discussion on R-squared by emphasizing its utility in explaining the percentage of variation accounted for by the relationship between two variables. It clarifies that while R-squared does not indicate the direction of correlation, it is a powerful tool for understanding the strength of a relationship in statistical analysis. The paragraph also reiterates the advantage of R-squared over 'r' in terms of ease of interpretation, especially when comparing the explanatory power of different correlations. The video concludes by encouraging viewers to tune in for future statistical adventures, leaving them with a better understanding of R-squared and its application in data analysis.
Mindmap
Keywords
💡R-squared
💡Correlation
💡Mean
💡Regression Line
💡Variation
💡Sum of Squared Differences
💡Statistically Significant
💡Percentage
💡Direction of Correlation
💡Predict
💡Independent Variable
Highlights
R-squared is a metric of correlation that is easy to compute and intuitive to interpret.
R-squared is very similar to 'r', but its interpretation is easier.
An 'r' value of 0.7 is twice as good a correlation as 'r' equals 0.5, but this is not obvious from the 'r' value alone.
R-squared equals 0.7 is 1.4 times as good as R-squared equals 0.5, providing a clearer comparison.
R-squared is calculated as the sum of the squared differences between the actual data points and the predicted values from a model, divided by the sum of the squared differences from the mean.
R-squared ranges from zero to one, representing the proportion of the variance for the dependent variable that's explained by the independent variables in the model.
An R-squared value of 0.81 or 81% indicates that 81% of the variation in the data is explained by the relationship between the two variables.
Comparing two uncorrelated variables, such as 'time spent sniffing a rock' and 'mouse weight', results in an R-squared of 0.06 or 6%, showing a very weak relationship.
A statistically significant R-squared of 0.9 means that 90% of the variation in the data is explained by the relationship between the two variables.
A statistically significant 'r' value squared gives you the R-squared value, which is easier to interpret.
R-squared does not indicate the direction of the correlation, as squared numbers are never negative.
R-squared is preferred over 'r' because it provides a clearer understanding of how much of the original variation is explained by the relationship.
When comparing 'r' values, squaring them in your head to get R-squared values will give you a better understanding of the strength of the correlation.
The size-weight relationship accounts for 81% of the total variation, indicating a strong correlation between mouse size and weight.
The sniff-weight relationship accounts for only 6% of the total variation, showing that the correlation is weak and other factors are likely more influential.
R-squared is particularly useful for quantifying the difference between the variation around the mean and the variation around a fitted line.
The example of mouse weight plotted against identification number and then against size demonstrates the ease of calculating R-squared and its intuitive appeal.
Transcripts
Browse More Related Video

R-squared, Clearly Explained!!!
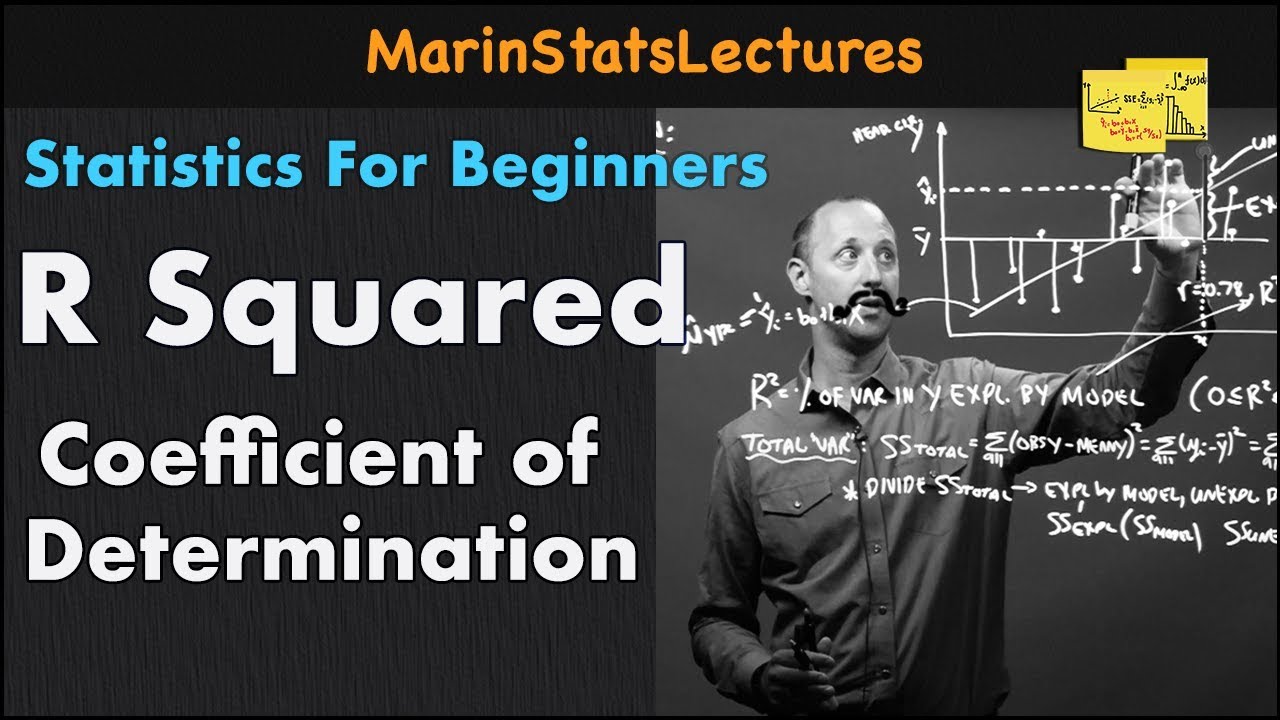
R Squared or Coefficient of Determination | Statistics Tutorial | MarinStatsLectures
Correlation and Coefficient of Determination in 3 Minutes

Regression II - Degrees of Freedom EXPLAINED | Adjusted R-Squared
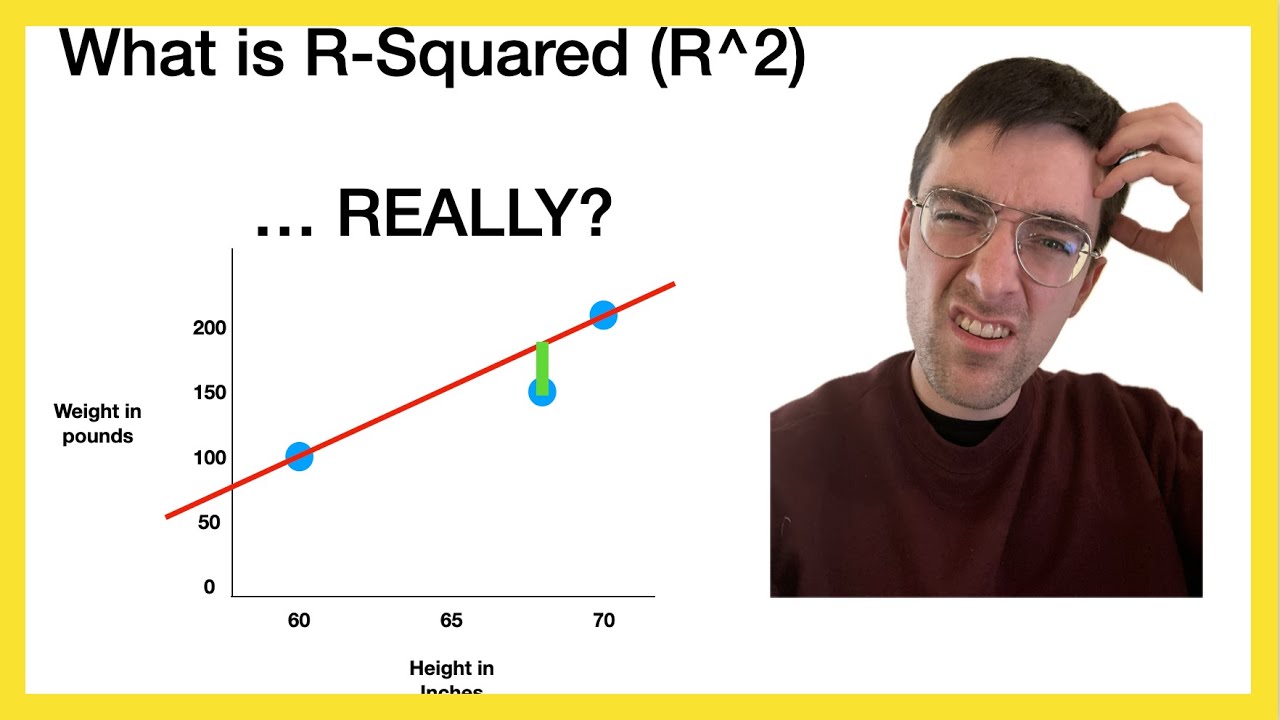
What is R-Squared (R^2) ... REALLY?

R Squared Explained in 5 minutes
5.0 / 5 (0 votes)
Thanks for rating: