R Squared Explained in 5 minutes
TLDRThe video script discusses R-squared, a crucial metric for evaluating model fit. It explains the concept by comparing regression lines to an average line, illustrating how the residual sum of squares (RSS) is minimized in regression to achieve a better fit than the average. R-squared is calculated as 1 - (RSS / total sum of squares), with values ranging from 0 to 1, where higher values indicate better fit. A rule of thumb for R-squared values is provided, with 0.9 indicating a very good model and below 0.4 suggesting a poor fit. The script emphasizes the importance of R-squared in model evaluation.
Takeaways
- 📊 R-squared is a crucial metric for evaluating the goodness of fit of regression models.
- 📈 The script introduces two versions of a chart: one with a regression line and one with an average line.
- 📍 The regression line is created by minimizing the residual sum of squares (RSS) using the ordinary least squares method.
- 🔍 The residual sum of squares measures the vertical distance between data points and the predicted values (y-hat).
- 📉 An average line is drawn by taking the mean of all actual y-values and projecting data points onto this line.
- 🔢 The total sum of squares (TSS) is calculated by comparing the actual y-values with the average y-value.
- 🔁 R-squared is calculated as 1 minus the ratio of RSS to TSS, indicating the proportion of variance explained by the model.
- 📌 A lower RSS compared to TSS indicates a better fit of the model to the data, resulting in a higher R-squared value.
- 🚫 R-squared values range from 0 to 1, with 0 indicating no fit and 1 indicating a perfect fit, although a perfect fit is nearly impossible.
- 📝 The script provides a rule of thumb for interpreting R-squared values: values close to 1 indicate a very good model, less than 0.7 is not great, less than 0.4 is quite poor, and less than 0 indicates a nonsensical model.
- 🔮 Understanding R-squared is essential as it is frequently used to assess the performance of regression models in machine learning.
Q & A
What is the R-squared value and why is it important?
-The R-squared value, also known as the coefficient of determination, is a statistical measure that represents the proportion of the variance for a dependent variable that's explained by an independent variable or variables in a regression model. It's important because it helps evaluate the goodness of fit of the model, indicating how well the model explains the variability of the data.
What are the two lines used in the script to compare model fit?
-The two lines are the regression line and the average line. The regression line is the best-fit line obtained through the ordinary least squares method, which minimizes the residual sum of squares. The average line is a horizontal line representing the average of the dependent variable values and serves as a baseline for comparison.
How is the residual sum of squares calculated?
-The residual sum of squares is calculated by taking the difference between the actual values (y_i) and the predicted values (ŷ_i) for each data point, squaring these differences, and then summing them all up.
What is the total sum of squares and how is it different from the residual sum of squares?
-The total sum of squares is the sum of the squared differences between each actual value (y_i) and the mean of all actual values (y_average). It's different from the residual sum of squares in that it measures the total variability of the data around the mean, not the variability around the regression line.
How is R-squared calculated from the residual sum of squares and the total sum of squares?
-R-squared is calculated using the formula R-squared = 1 - (residual sum of squares / total sum of squares). It represents the proportion of the variance in the dependent variable that is predictable from the independent variable(s).
Why is the residual sum of squares usually less than the total sum of squares?
-The residual sum of squares is usually less than the total sum of squares because the regression line is specifically designed to minimize the distances between the data points and the line itself, which results in a smaller sum of squared differences compared to the average line.
What does an R-squared value close to 1 indicate about the model?
-An R-squared value close to 1 indicates that the model has a high degree of explanatory power, meaning that the independent variables account for most of the variability in the dependent variable.
What does an R-squared value less than 0.7 suggest about the model's fit?
-An R-squared value less than 0.7 suggests that the model is not a great fit for the data. It indicates that the model does not explain a significant portion of the variability in the dependent variable.
What is the significance of an R-squared value less than 0.4?
-An R-squared value less than 0.4 indicates that the model is quite poor at explaining the variability in the data. It suggests that the model is not a good representation of the relationship between the variables.
What does it mean if the R-squared value is less than zero?
-An R-squared value less than zero is nonsensical and indicates that the model is performing worse than a horizontal line at the mean, which suggests a serious issue with the model's specification or the data itself.
Why might an R-squared value of 0.9 be suspicious?
-An R-squared value of 0.9 is suspicious because it suggests an almost perfect fit, which is rare in real-world data. It may indicate overfitting, where the model is too closely tailored to the specific sample of data and may not generalize well to new data.
Outlines
📊 Understanding R Squared in Regression Models
This paragraph introduces the concept of R squared, which is crucial for evaluating the goodness of fit in regression models. It mentions that to understand R squared, we need to look at two versions of a chart: one with a regression line and one with an average line.
📈 Plotting the Regression Line
In this section, the process of plotting the regression line on the data set is described. It explains how to draw the regression line, project data points onto it, and examine the difference between the actual values (y_i) and the predicted values (y_i_hat). This method, called Ordinary Least Squares, minimizes the residual sum of squares.
📉 Plotting the Average Line
This part explains how to plot an average line by taking the average of all y values in the data set. The difference between the actual values (y_i) and the average value (y_avg) is calculated to get the total sum of squares. The comparison between the residual sum of squares and the total sum of squares is introduced.
📏 Calculating R Squared
R squared is defined as 1 minus the ratio of the residual sum of squares to the total sum of squares. The paragraph discusses how minimizing the residual sum of squares results in shorter projected lines compared to the total sum of squares, leading to an R squared value between 0 and 1. A better model fit corresponds to a higher R squared value.
🔍 Interpreting R Squared Values
This section provides a rule of thumb for interpreting R squared values. A value close to 1 indicates a perfect fit, while values around 0.9 indicate a very good model. Values below 0.7 are not great, below 0.4 are poor, and negative values mean the model is not suitable for the data. The importance of understanding R squared for model evaluation is emphasized.
📚 Conclusion and Next Steps
The concluding paragraph reinforces the importance of understanding R squared in evaluating models. It encourages readers to apply this concept and look forward to future learning in the field of machine learning.
Mindmap
Keywords
💡R-squared
💡Goodness of Fit
💡Regression Line
💡Residual Sum of Squares (RSS)
💡Total Sum of Squares (TSS)
💡Ordinary Least Squares (OLS)
💡Predicted Value (Y-hat)
💡Average Line
💡Model Fit
💡Rule of Thumb
Highlights
Introduction to r squared as a key concept for evaluating the goodness of fit in models.
Explanation of plotting regression lines and projecting data points onto these lines.
Definition and calculation of the residual sum of squares using the difference between actual and predicted values.
Introduction of the average line and the calculation of the total sum of squares.
Comparison of residual sum of squares and total sum of squares to understand model fit.
Detailed explanation of how r squared is calculated as 1 minus the ratio of residual sum of squares to total sum of squares.
Visualization of data points projection and comparison of lengths of dashed lines in regression and average line plots.
Clarification that the residual sum of squares is generally less than the total sum of squares, indicating a better fit for the model.
Discussion on the interpretation of r squared values, emphasizing the range between 0 and 1.
Rule of thumb for r squared values: 1 for a perfect fit, above 0.9 for a very good model, below 0.7 for a not-so-great model, below 0.4 for a terrible model, and below 0 for an incorrect model.
Contextual note that the r squared rule of thumb varies depending on the specific application and dataset.
Final summary on the importance of understanding r squared for evaluating models in machine learning.
Encouragement to enjoy learning about machine learning concepts and their practical applications.
Sign-off and anticipation for the next session on machine learning concepts.
Transcripts
Browse More Related Video

How to calculate a regression equation, R Square, Using Excel Statistics
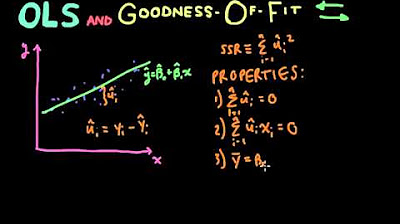
Econometrics // Lecture 3: OLS and Goodness-Of-Fit (R-Squared)

How to Calculate R Squared Using Regression Analysis

Adjusted R Squared, Clearly Explained

What is Ressidual Sum of Squares(RSS) in Regression (Machine Learning)
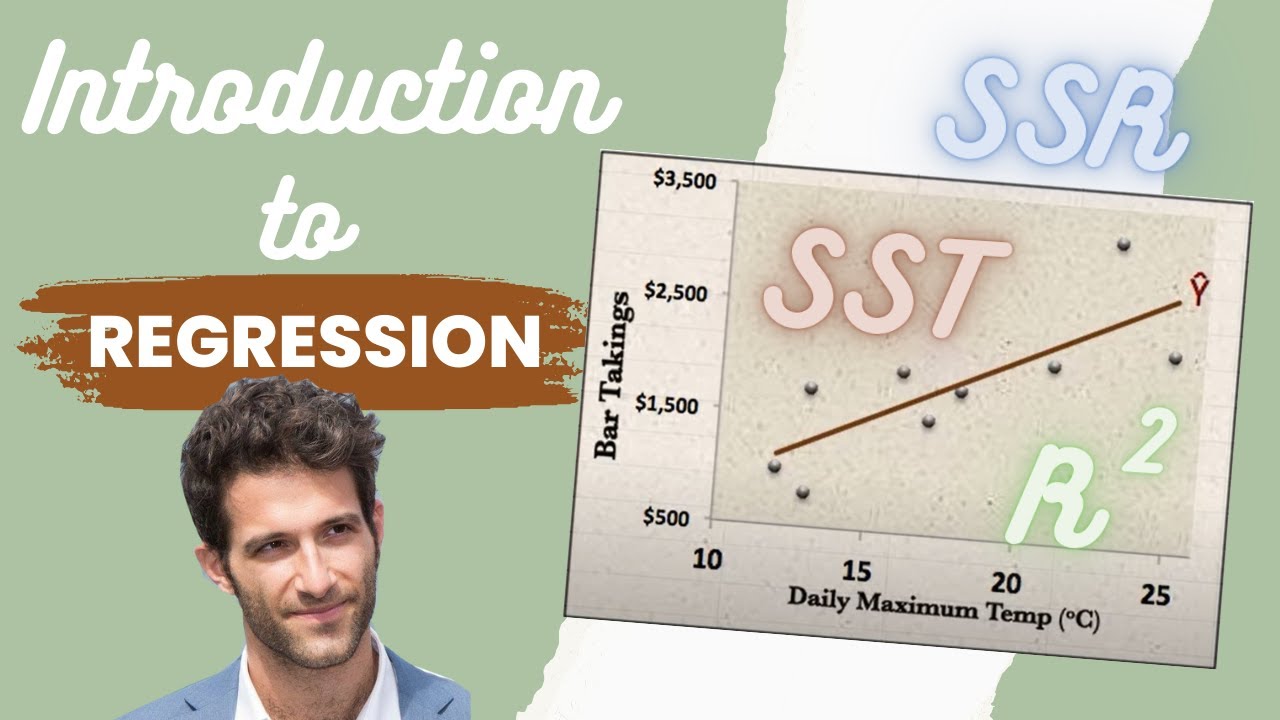
Introduction to REGRESSION! | SSE, SSR, SST | R-squared | Errors (ε vs. e)
5.0 / 5 (0 votes)
Thanks for rating: