R Squared or Coefficient of Determination | Statistics Tutorial | MarinStatsLectures
TLDRThis transcript delves into the concept of R-squared, or the coefficient of determination, a statistical measure that gauges the performance of a regression model. It explains that R-squared, ranging from 0 to 1, represents the proportion of variance for the dependent variable that's explained by the independent variables in the model. The discussion includes the visual representation of R-squared, its interpretation, and the introduction of adjusted R-squared, which accounts for the number of predictors in the model. The limitations of R-squared are also highlighted, emphasizing the need for model validation techniques like cross-validation to predict unseen data.
Takeaways
- 📊 R-squared, or the coefficient of determination, measures the goodness of fit of a model to observed data, particularly in linear regression contexts.
- 🔢 R-squared values range from 0 to 1, with higher values indicating a better fit of the model to the data.
- 🔄 In simple linear regression, R-squared is equivalent to the square of the Pearson's correlation coefficient.
- 📈 R-squared represents the proportion of the variance in the dependent variable (Y) that is predictable from the independent variable (X).
- 🤔 The concept of R-squared can be visualized by dividing the total variability in Y into explained and unexplained parts by the model.
- 🔢 The formula for R-squared is the sum of squares explained (by the model) divided by the total sum of squares (total variability in Y).
- 🔄 Adjusted R-squared is a modified version of R-squared that introduces a penalty for the number of predictors in the model, making it more appropriate for multiple linear regression.
- 🔍 Adjusted R-squared helps to counteract the inherent upward bias in R-squared when adding more predictors to the model, even if they have a weak association with the outcome.
- 🚫 A limitation of R-squared is that it is calculated using the same data that was used to build the model, which may not accurately represent the model's predictive power on new data.
- 📊 Validation techniques such as cross-validation or leave-one-out methods are used to assess how well a model can predict data not used in its construction.
Q & A
What is R-squared?
-R-squared, also known as the coefficient of determination, is a statistical measure that represents the proportion of the variance for a dependent variable that's explained by an independent variable or variables in a regression model.
How is R-squared calculated in simple linear regression?
-In simple linear regression, R-squared is calculated as the square of the Pearson's correlation coefficient. It represents the proportion of the variance in the dependent variable that's explained by the independent variable.
What does the value of R-squared indicate about the model fit?
-The value of R-squared ranges from 0 to 1. A value closer to 1 indicates a better fit of the model to the data, meaning the model explains a larger percentage of the variability in the dependent variable.
What is the difference between R-squared and adjusted R-squared?
-Adjusted R-squared is a modified version of R-squared that includes a penalty for the number of independent variables in the model. It is used in multiple linear regression to counteract the tendency of R-squared to increase when additional variables are added, even if they have a weak association with the dependent variable.
What are the limitations of using R-squared as a measure of model fit?
-R-squared has a limitation in that it only measures how well the model fits the data used to build it, which can lead to overfitting. It does not indicate how well the model will perform on new, unseen data. For a more robust measure, techniques like cross-validation or leave-one-out methods can be used.
How does the total sum of squares relate to R-squared?
-The total sum of squares represents the total variability in the dependent variable. R-squared is calculated as the ratio of the explained sum of squares (by the model) to the total sum of squares, indicating the proportion of variability explained by the model.
What is the explained sum of squares in the context of R-squared?
-The explained sum of squares is the portion of the total variability in the dependent variable that is accounted for by the regression model. It is the sum of the squared differences between the predicted values and the mean of the dependent variable.
What is the unexplained sum of squares in the context of R-squared?
-The unexplained sum of squares, also known as the sum of squared residuals or error, is the portion of the total variability in the dependent variable that is not accounted for by the regression model. It represents the differences between the actual observed values and the predicted values from the model.
How does R-squared relate to the concept of variance in a statistical model?
-R-squared is directly related to the variance in a statistical model. It measures the proportion of the variance in the dependent variable that is explained by the independent variables included in the model. A higher R-squared value indicates that a larger percentage of the variance is explained by the model.
Can R-squared be greater than 1?
-No, R-squared cannot be greater than 1. Its value is always between 0 and 1, inclusive. A value of 0 indicates that the model does not explain any of the variability in the dependent variable, while a value of 1 indicates that the model explains all the variability.
What is the significance of R-squared in statistical modeling?
-R-squared is significant in statistical modeling as it provides a quick measure of how well a model fits the observed data. It helps in understanding the effectiveness of the model in explaining the relationship between the dependent and independent variables.
Outlines
📊 Introduction to R-Squared
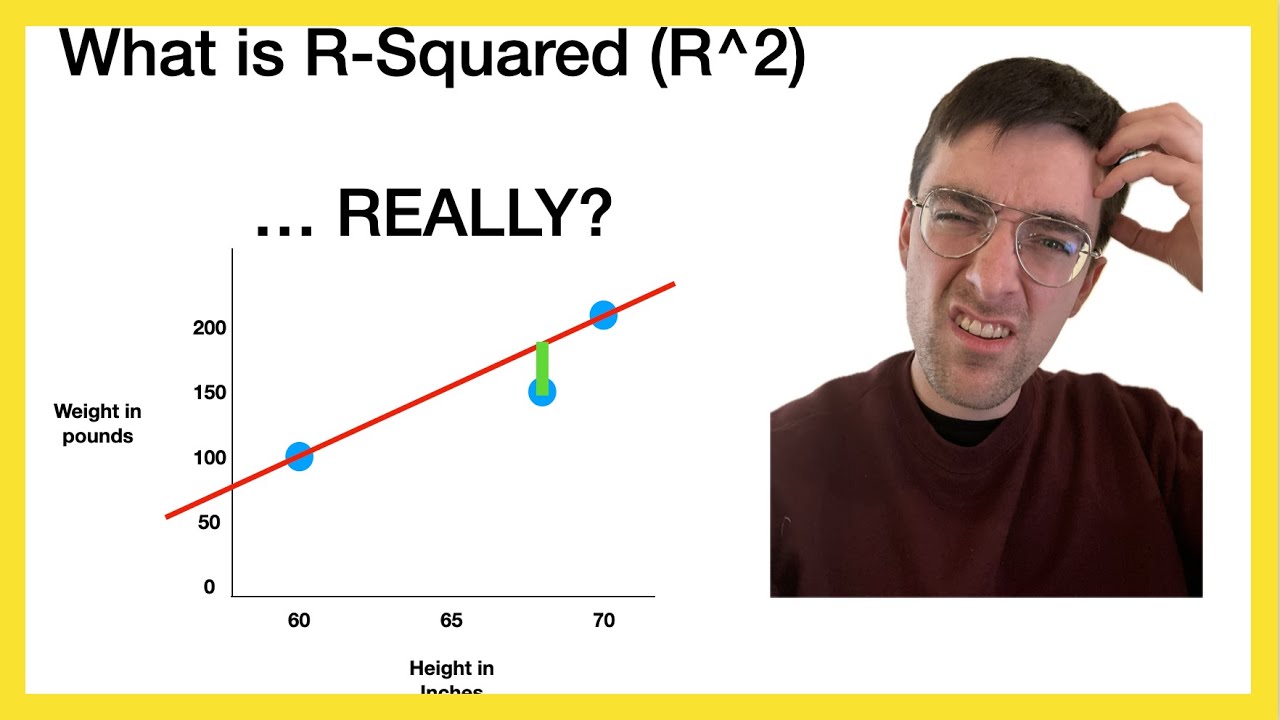
This paragraph introduces R-squared, also known as the coefficient of determination, as a measure of how well a model fits observed data. It specifically focuses on simple linear regression for the sake of simplicity, though the concept is applicable to multiple linear regression as well. The example given involves the relationship between gestational age and head circumference of babies. R-squared is calculated as the square of Pearson's correlation coefficient, which in this case is 0.78, leading to an R-squared value of 0.608 or approximately 61%. This indicates that 61% of the variability in head circumference can be explained by gestational age. The paragraph emphasizes that R-squared values range from 0 to 1, with higher values indicating a better fit of the model to the data.
🔍 Breaking Down Total Variability
This paragraph delves into the concept of total variability in Y values and how it can be divided into two parts: the variability explained by the model and the variability unexplained by the model. The speaker uses a visual approach to explain this concept, drawing a regression line and distinguishing between observed values and predicted values. The total sum of squares is broken down into the sum of squares explained by the model (also known as the sum of squares regression or treatment) and the sum of squares unexplained by the model (sum of squared error). The R-squared value is then defined as the ratio of the explained sum of squares to the total sum of squares, providing a visual and mathematical understanding of how much of the variability in Y can be attributed to the model.
📉 Adjusted R-Squared and Limitations
The final paragraph discusses the concept of adjusted R-squared, which penalizes the R-squared value for the number of X variables in the model. This is particularly relevant in multiple linear regression, where adding variables that are unrelated to Y can still slightly increase R-squared. Adjusted R-squared aims to counteract this by penalizing the model for including such variables. The paragraph also touches on the limitations of R-squared, noting that it is calculated using the same data that was used to build the model, which may not accurately represent the model's predictive power on new data. The speaker suggests exploring validation techniques such as cross-validation and leave-one-out approaches to better assess model fit on unseen data.
Mindmap
Keywords
💡R-squared
💡Linear Regression
💡Pearson's Correlation Coefficient
💡Total Sum of Squares
💡Explained Variability
💡Unexplained Variability
💡Adjusted R-squared
💡Regression Line
💡Sum of Squares Explained
💡Sum of Squared Errors
Highlights
R-squared, also known as the coefficient of determination, is a measure of how well a model fits observed data.
In the context of linear regression, R-squared is discussed in terms of simple linear regression for simplicity, but the concept also applies to multiple linear regression.
R-squared is essentially the Pearson's correlation coefficient squared, which indicates the strength and direction of a linear relationship between two variables.
The value of R-squared ranges between 0 and 1, with values closer to 1 indicating a better fit of the model to the data.
R-squared tells us the percentage of variability in the dependent variable (Y) that is explained by the model.
In the provided example, 61% of the variability in head circumference can be explained by gestational age.
The total sum of squares can be divided into two parts: the sum of squares explained by the model and the sum of squares unexplained by the model.
The sum of squares explained by the model is also known as the sum of squares regression, while the unexplained part is called the sum of squared error.
R-squared can be visually represented by comparing the distances of observed values from the mean to the distances of predicted values from the mean.
Adjusted R-squared is introduced as a modification to R-squared that includes a penalty for the number of predictor variables in the model.
Adjusted R-squared is particularly relevant in multiple linear regression to counteract the tendency of R-squared increasing with the addition of more variables.
The limitations of R-squared include its calculation using the same data that was used to build the model, which may not accurately represent the model's predictive power on new data.
Validation techniques such as cross-validation and leave-one-out methods are suggested as ways to assess how well a model predicts new, unseen data.
R-squared, despite its limitations, remains a useful measure of model fit and is a fundamental concept in regression analysis.
The video content aims to provide a deeper understanding of R-squared and its implications in the context of linear regression models.
Transcripts
Browse More Related Video


5.0 / 5 (0 votes)
Thanks for rating: