Regression II - Degrees of Freedom EXPLAINED | Adjusted R-Squared
TLDRThis video delves into the statistical concepts of R-squared and Adjusted R-squared, emphasizing their importance in measuring the strength of the relationship between variables in regression analysis. It clarifies the role of degrees of freedom in affecting R-squared values and introduces the formula for calculating degrees of freedom. The video also highlights how adding unnecessary variables can inflate R-squared but may decrease Adjusted R-squared, which accounts for the number of observations and variables, providing a more accurate assessment of model fit.
Takeaways
- 📊 The video discusses the statistical concept of regression, focusing on R-squared (R²) and Adjusted R-squared, as well as degrees of freedom.
- 🔍 R² is defined as the proportion of variation in the dependent variable (y) explained by the independent variable (x), calculated as SSR/SST.
- 📉 In the script, different scatter plots are used to illustrate how the relationship between X and Y weakens as R² decreases.
- 🚫 It is clarified that R² values can range from 0 to 1, with 1 indicating a perfect linear relationship and 0 indicating no relationship at all.
- 📈 Degrees of freedom are introduced as a concept that helps understand the model's ability to assess the relationship between variables.
- 🔢 The minimum number of observations required to estimate a simple linear regression is three, providing the model with one degree of freedom.
- 🔄 As more variables are added to the model, the degrees of freedom decrease, which can affect the R² value.
- 🌟 Adjusted R² is introduced as a metric to account for the reduced power in the model when there are a low number of degrees of freedom.
- 💡 Adjusted R² can decrease even when the number of variables increases, reflecting the loss of degrees of freedom and not necessarily the addition of explanatory power.
- 📊 The script emphasizes the importance of not being deceived by high R² values when degrees of freedom are low, and using Adjusted R² for a more accurate assessment.
- 🎓 The video aims to provide an intuitive understanding of degrees of freedom and R², helping students grasp these concepts in the context of regression analysis.
Q & A
What is the main topic of the video?
-The main topic of the video is the statistical concept of regression, focusing on R-square (R^2), adjusted R-square, and the notion of degrees of freedom.
What is the definition of R-square given in the video?
-R-square is defined as the ratio of the sum of squares due to regression (SSR) to the total sum of squares (SST), representing the proportion of variation in the dependent variable (y) that is explained by the variation in the independent variable (x).
What does the value of R-square range between?
-The value of R-square ranges between 0 and 1, with 1 indicating a perfect linear relationship and 0 indicating no relationship at all.
What is the concept of degrees of freedom in the context of regression?
-Degrees of freedom in regression refers to the number of independent observations that can vary freely when estimating a regression model. It is related to the number of observations and the number of parameters (variables) in the model.
How does the addition of variables affect degrees of freedom in a regression model?
-Adding variables to a regression model decreases the degrees of freedom because each new variable adds an additional constraint to the model, reducing the number of observations that can vary freely.
What is the formula for calculating degrees of freedom in a regression model?
-The formula for degrees of freedom in a regression model is 'degrees of freedom = number of observations (n) minus the number of explanatory variables (K) minus 1'.
Why is adjusted R-square used in regression analysis?
-Adjusted R-square is used to account for the reduced power in the model when there is a low number of degrees of freedom. It adjusts the R-square value to penalize the addition of unnecessary variables that do not contribute to the model's explanatory power.
How does adjusted R-square differ from R-square?
-Adjusted R-square is calculated to account for the number of variables and degrees of freedom in the model. Unlike R-square, which can increase with the addition of more variables, adjusted R-square can decrease, reflecting the loss of degrees of freedom and potentially overfitting the model.
Can adjusted R-square have negative values?
-Yes, adjusted R-square is not bounded by zero and one, and it can take on negative values in certain situations, such as when the model fits worse than the mean of the response variable.
What does the video suggest about selecting the best regression model?
-The video suggests that the best regression model is the one that has the highest adjusted R-square value, as it accounts for the number of variables and the degrees of freedom, indicating a good balance between explanatory power and model complexity.
How can the concepts of R-square, adjusted R-square, and degrees of freedom help in understanding the strength of a regression model?
-R-square indicates the proportion of variance explained by the model, adjusted R-square provides a more accurate measure by accounting for the number of variables, and degrees of freedom help in assessing the model's flexibility and the reliability of the estimates. Together, these concepts help in evaluating the model's explanatory power and potential overfitting.
Outlines
📊 Introduction to Regression Concepts
This paragraph introduces the viewer to the second video in a five-part series on regression. It briefly recaps the basics of regression covered in the first video, such as sums of squares (SST, SS, and SSR), error terms, and the correlation coefficient (r). The speaker encourages viewers who found these concepts confusing to review the previous video for clarity. The main focus of this segment is to delve deeper into R-squared (R²) and adjusted R-squared, and to introduce the concept of degrees of freedom, which the speaker aims to explain intuitively. The speaker also clarifies the notation used for SSR and SSE, highlighting the importance of understanding the meaning of R and E in these acronyms.
🔍 Understanding Degrees of Freedom
The speaker explains the concept of degrees of freedom in the context of simple linear regression with one independent variable (X) and one dependent variable (Y). It is illustrated that a minimum of two observations is required to perform regression, but two points do not provide a meaningful assessment of the relationship between X and Y, as any line can be drawn through two points, resulting in an R² of one. The introduction of a third observation grants the model the freedom to assess the strength of the relationship, leading to a more accurate R² value. The speaker further elaborates on how degrees of freedom interact with the number of variables in a model, using a three-dimensional analogy with two X variables and one Y variable. The minimum number of observations required to estimate the regression increases with each additional variable, and the degrees of freedom decrease as more variables are added. A formula for calculating degrees of freedom (df = n - k - 1) is provided, where n is the number of observations and k is the number of explanatory variables.
📉 Adjusted R-Squared and Its Importance
The speaker discusses the limitations of R-squared when the number of degrees of freedom is low and introduces adjusted R-squared as a metric to address this issue. Adjusted R-squared accounts for the reduced model power when the number of degrees of freedom is low, and its formula is provided. The speaker explains that as the number of variables (k) increases, adjusted R-squared tends to decrease, holding all other factors constant. This reflects the loss of degrees of freedom and not necessarily an increase in explanatory power. The speaker uses a hypothetical scenario with different numbers of observations and variables to illustrate how R-squared and adjusted R-squared can differ, especially when the number of variables is high relative to the number of observations. The importance of adjusted R-squared is emphasized as it can fall below zero, unlike R-squared, which is bounded by zero and one. Adjusted R-squared provides a way to compare models and select the one with the best explanatory power, as demonstrated in the hypothetical scenario where the model with six variables is preferred over the one with seven variables.
Mindmap
Keywords
💡Regression
💡Sum of Squares (SST, SSM, SSR)
💡R-squared (R2)
💡Adjusted R-squared
💡Degrees of Freedom
💡Error Terms
💡Best Fit Line
💡Scatter Plots
💡Linear Relationship
💡Overfitting
💡Useful Variables
Highlights
Exploring the concept of regression in statistics, particularly focusing on R-squared and adjusted R-squared.
Recap of previous video content, including basics of regression, sums of squares, error terms, and R-squared.
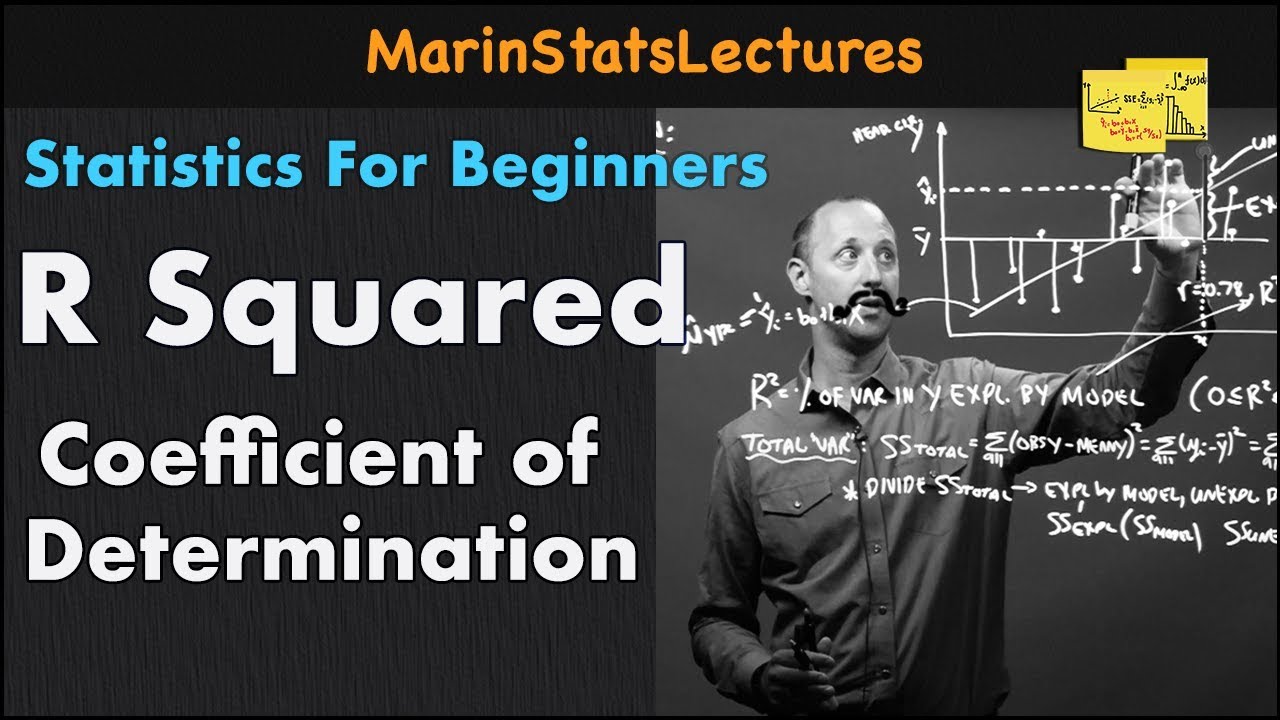
Definition of R-squared as the proportion of variation in y explained by the variation in X.
Discussion on the sum of squares due to regression (SSR) and sum of squares due to error (SSE), and their roles in calculating R-squared.
Clarification on the acronyms SSR and SSE, emphasizing the importance of understanding what the letters represent.
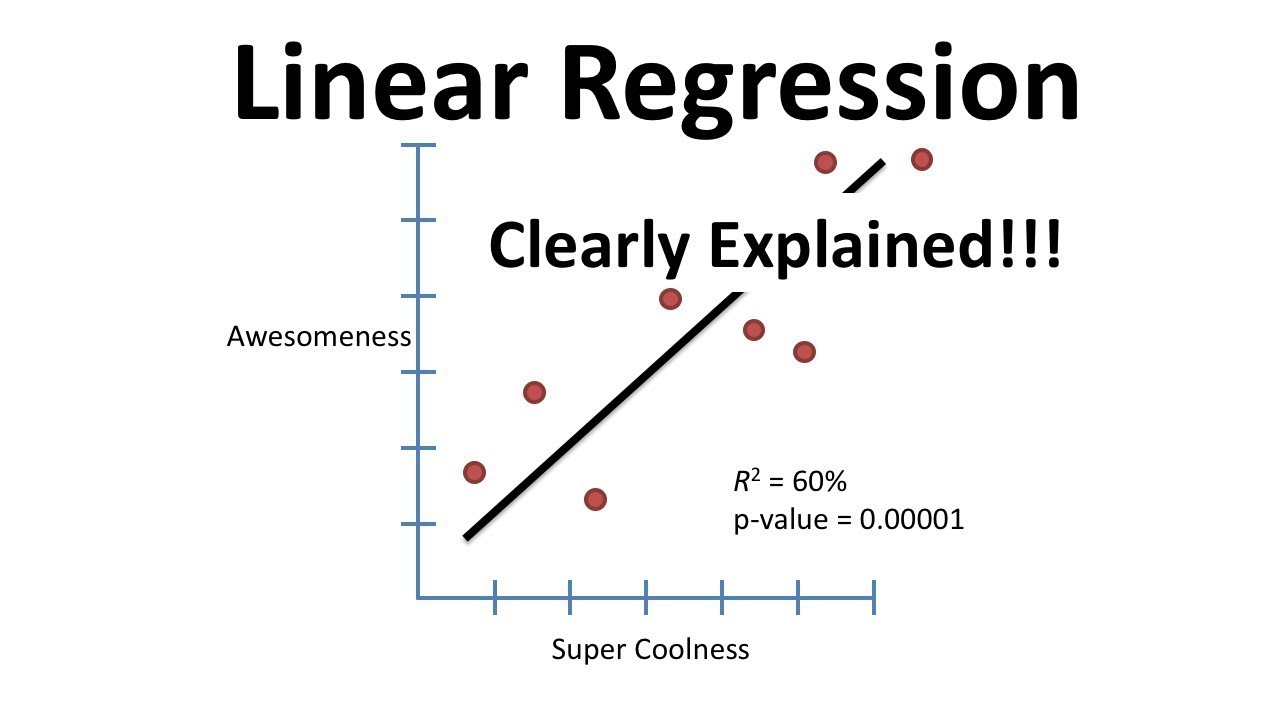
Illustration of R-squared values with unique scatter plots, showing the strength of the relationship between X and Y.
Explanation of the significance of R-squared values ranging from 0 to 1, with 1 indicating a perfect linear relationship and 0 indicating no relationship.
Introduction to the concept of degrees of freedom in statistics, highlighting its importance and intuitive explanation.
Minimum number of observations required to estimate a simple linear regression with one dependent and one independent variable.
How the addition of a third observation provides the model with freedom to assess the strength of the relationship between X and Y.
The impact of adding a second variable on the minimum number of observations needed and how it affects degrees of freedom.
Formula for degrees of freedom in relation to the number of observations and explanatory variables.
How degrees of freedom are closely related to R-squared and its effect on the measure of the strength of the relationship between X and Y.
Introduction to adjusted R-squared as a metric to account for the reduced power in the model when there is a low number of degrees of freedom.
Explanation of how adjusted R-squared can decrease when the number of variables increases, holding everything else constant.
Use of adjusted R-squared to compare models and select the best one based on explanatory power, even when R-squared increases with additional variables.
Note on adjusted R-squared not being bounded by zero and one, and its ability to go into negative values, providing a way to compare models.
Transcripts
Browse More Related Video
R Squared or Coefficient of Determination | Statistics Tutorial | MarinStatsLectures

Adjusted R Squared, Clearly Explained

Learn Statistical Regression in 40 mins! My best video ever. Legit.
Linear Regression, Clearly Explained!!!

Linear Regression, Clearly Explained!!!
What is R-Squared (R^2) ... REALLY?
5.0 / 5 (0 votes)
Thanks for rating: