What is R-Squared (R^2) ... REALLY?
TLDRThe transcript delves into the concept of R-squared (R^2) in the context of regression analysis. It explains how R^2 represents the proportion of variance in the dependent variable (Y) that's explained by the independent variable (X). Using examples, the script illustrates how understanding the relationship between variables, such as height and weight, can lead to more accurate predictions and reduce the sum of squared errors. The least squares regression line is highlighted as the best fit, minimizing these errors and maximizing R^2, thereby explaining the most variance in the data.
Takeaways
- 📊 R-squared (R²) represents the percentage of variation in the dependent variable (Y) that is predictable from the independent variable (X).
- 🔢 A higher R² value indicates a better fit of the model to the data, meaning the independent variable explains more of the variability in the dependent variable.
- 🧐 The concept of variance is introduced as the average squared distance from the mean, which helps in understanding the spread of data points around the average.
- 🏆 The least squares regression aims to minimize the sum of squared errors, leading to a higher R² and a better model fit.
- 🤔 The script uses an example of predicting weight from height to demonstrate how R² can be calculated and interpreted.
- 📉 The sum of squared errors (SSE) is reduced when a relationship between variables is utilized, as shown by the decrease from 5000 to 900 when considering the effect of height on weight.
- 📈 The total sum of squares (SST) is the sum of squared deviations of each data point from the mean, representing the total variation in the dataset.
- 🔄 The script explains that R² can be calculated as the ratio of the sum of squares due to regression (SSR) to the total sum of squares (SST), or as 1 minus the ratio of the sum of squared errors (SSE) to SST.
- 👽 The hypothetical scenario of aliens learning about human weights introduces the concept of prediction and the improvement in predictions with more information.
- 📝 The script emphasizes the importance of understanding the relationship between variables to improve predictions and reduce errors.
- 🔍 The concept of residuals (errors) is crucial in regression analysis, as it measures the difference between the actual and predicted values.
Q & A
What does 'R' typically represent in a statistical context?
-In a statistical context, 'R' often represents the correlation coefficient, which is a measure of the strength and direction of a linear relationship between two variables.
How is the percentage of variation explained by a predictor variable represented?
-The percentage of variation explained by a predictor variable is represented by the square of the correlation coefficient (R^2). It indicates how much of the variability in the dependent variable is predictable from the independent variable.
What does variance measure in a dataset?
-Variance measures the average squared deviation from the mean in a dataset. It provides an understanding of how spread out the data points are around the mean value.
What is the significance of a low variance in a dataset?
-A low variance in a dataset indicates that most of the data points are close to the mean, suggesting that the mean is a good estimate for predicting future values.
How is the standard deviation related to variance?
-The standard deviation is the square root of the variance. It provides a measure of dispersion in the same units as the data, making it easier to interpret than variance, which is in squared units.
What is the purpose of the sum of squared errors in regression analysis?
-The sum of squared errors in regression analysis measures the difference between the predicted values and the actual values. It helps in assessing the accuracy of the regression model and in comparing the performance of different models.
How do we improve predictions using regression analysis?
-We improve predictions using regression analysis by finding a line (or model) that best fits the data, typically through least squares regression. This line minimizes the sum of squared errors, leading to more accurate predictions and a higher R^2 value.
What does the term 'residual' refer to in the context of regression analysis?
-In regression analysis, a 'residual' refers to the difference between the actual value of the dependent variable and the predicted value from the regression model. It represents the error of prediction.
What is the formula for calculating the R^2 value in regression analysis?
-The formula for calculating the R^2 value in regression analysis is R^2 = SS_regression / SS_total, where SS_regression is the sum of squared errors of the regression model and SS_total is the total sum of squares (the sum of squared deviations from the mean of the dependent variable).
How does the R^2 value change when comparing a simple mean guess to a more complex model?
-When comparing a simple mean guess to a more complex model, the R^2 value typically increases with the more complex model. This is because a more complex model (like a regression line that considers more variables) aims to minimize the sum of squared errors, thereby explaining more of the variability in the dependent variable.
What does it mean when we say '82% of the variability of weight can be explained by height'?
-When we say '82% of the variability of weight can be explained by height', it means that 82% of the differences in weight among individuals can be accounted for by differences in their height, as described by the regression model.
What is the significance of minimizing the sum of squared errors in regression analysis?
-Minimizing the sum of squared errors in regression analysis is significant because it leads to a model that has the best fit to the data. This results in more accurate predictions and a higher R^2 value, indicating a stronger relationship between the independent and dependent variables.
Outlines
📊 Introduction to R-Squared and Variance
This paragraph introduces the concept of R-Squared (R²) and variance in the context of explaining variability in data. It starts with a hypothetical scenario where an alien tries to predict a human's weight based on the average weight of three individuals. The explanation then moves to variance, which measures the average squared distance from the mean, and how it relates to the ability to predict future values. The paragraph further discusses the concept of sum of squared errors and how it can be used to gauge the accuracy of predictions. It concludes by illustrating how using additional information, such as height, can improve the prediction of weight and reduce the sum of squared errors, thus increasing the R-Squared value.
📈 Improving Predictions with Regression Analysis
This paragraph delves into the process of improving predictions through regression analysis. It begins by introducing a linear regression model that uses height to predict weight, resulting in a more accurate prediction and a decrease in the sum of squared errors. The explanation continues with a more advanced regression model that further reduces the sum of squared errors and increases the R-Squared value to 89.3%. The paragraph then breaks down the original sum of squared errors into两部分: the sum of squared residuals (SS error) and the sum of squared explained variation (SS regression). It concludes by explaining how R-Squared can be calculated using these two components and emphasizes that R-Squared represents the percentage of variation in Y explained by X or the regression line, showcasing the effectiveness of using a more complex model over a simple mean guess.
Mindmap
Keywords
💡R-squared (R^2)
💡Variance
💡Regression Line
💡Sum of Squared Errors (SSE)
💡Least Squares Regression
💡Total Sum of Squares (SST)
💡Residual
💡Predictive Modeling
💡Average (Mean)
💡Scatter Plot
💡Linear Regression
Highlights
The concept of R-squared (R^2) is introduced as the percentage of variation in Y explained by X.
An example is given where height explains 80% of the variability in weight.
Variance is defined as the average squared distance from the mean.
Low variance indicates that most values are close to the mean, making future value predictions more reliable.
The sum of squared errors is a measure of how far the data points are from the mean.
The relationship between height and weight is used to predict weight more accurately than just using the average.
The formula for predicting weight based on height is -500 + 10 * height.
By using the height-weight relationship, the sum of squared errors is reduced from 5,000 to 900.
The new line (red line) explains 82% of the variability in weight, showing an improvement in prediction.
Another line (green line) is introduced with a more complex formula, resulting in an even better prediction of weight.
The green line reduces the sum of squared errors to 5357, explaining 89.3% of the variation in weight.
The least squares regression line minimizes the sum of squared errors, maximizing the R-squared value.
R-squared can be calculated using the formula R^2 = SS_regression / SS_total or 1 - (SS_error / SS_total).
The total sum of squares (SS_total) can be broken down into SS_regression and SS_error.
R-squared represents the percent reduction in sum of squared errors when using a more complex model compared to guessing the mean.
The transcript provides a clear and detailed explanation of R-squared, its calculation, and its significance in regression analysis.
Transcripts
Browse More Related Video
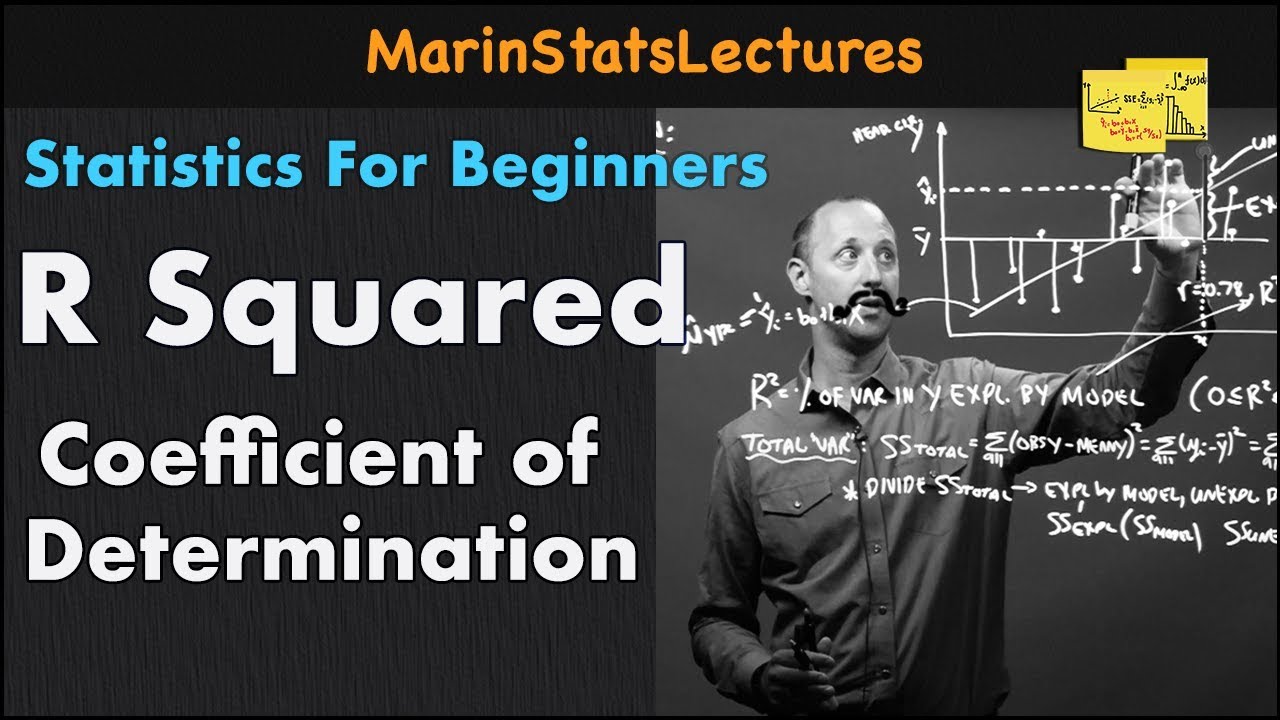
R Squared or Coefficient of Determination | Statistics Tutorial | MarinStatsLectures
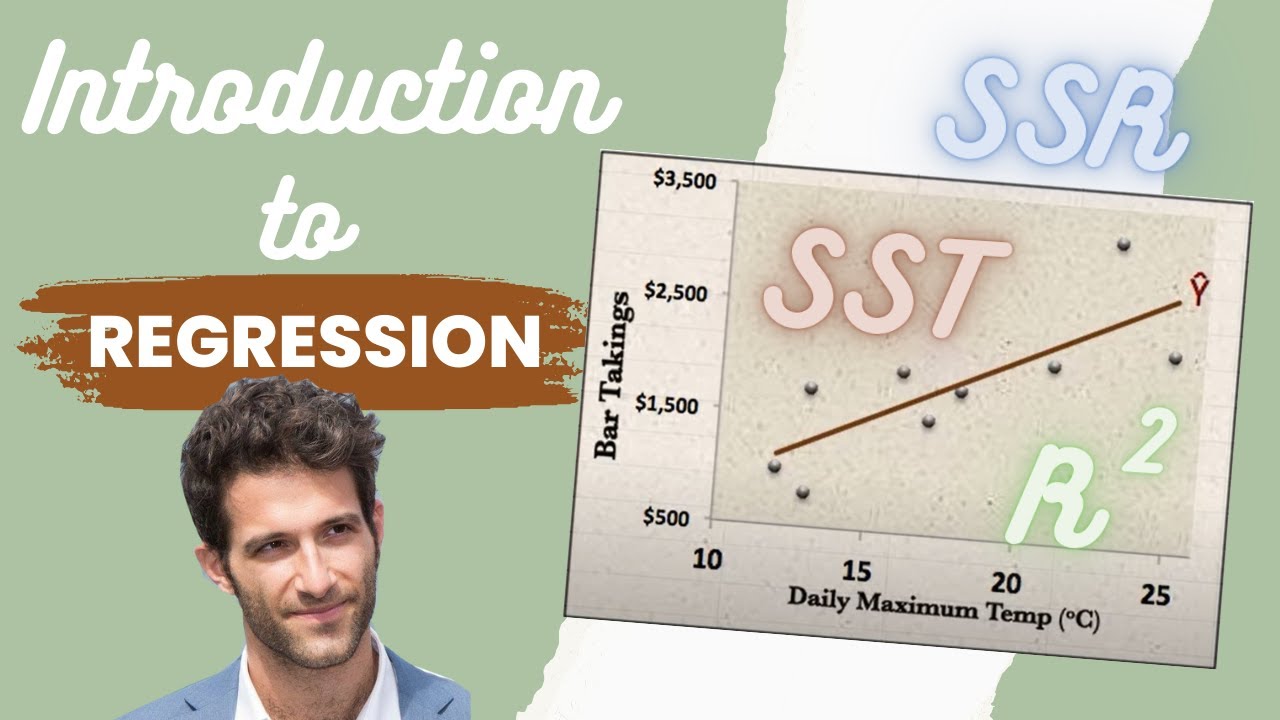
Introduction to REGRESSION! | SSE, SSR, SST | R-squared | Errors (ε vs. e)
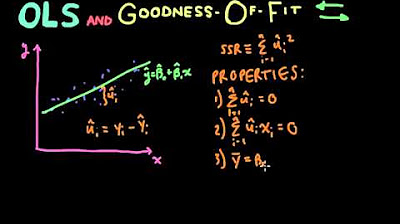
Econometrics // Lecture 3: OLS and Goodness-Of-Fit (R-Squared)

Regression and R-Squared (2.2)
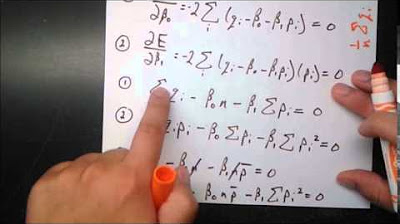
Ordinary Least Squares Regression

R-squared, Clearly Explained!!!
5.0 / 5 (0 votes)
Thanks for rating: