Correlation and Coefficient of Determination in 3 Minutes
TLDRThis video script explains the Pearson correlation coefficient (R), which measures the strength and direction of a linear relationship between two variables on a scale from -1 to 1. A value close to zero indicates no correlation, while values near one or negative one suggest strong positive or negative correlations, respectively. The script also introduces the coefficient of determination (R-squared), which quantifies the impact of an input variable on an output variable, scoring between 0 and 1. An R-squared value approaching one indicates a strong, predictable relationship. The video concludes with a discussion on using the sum of squared residuals to compare the effectiveness of linear regression against a simple average prediction.
Takeaways
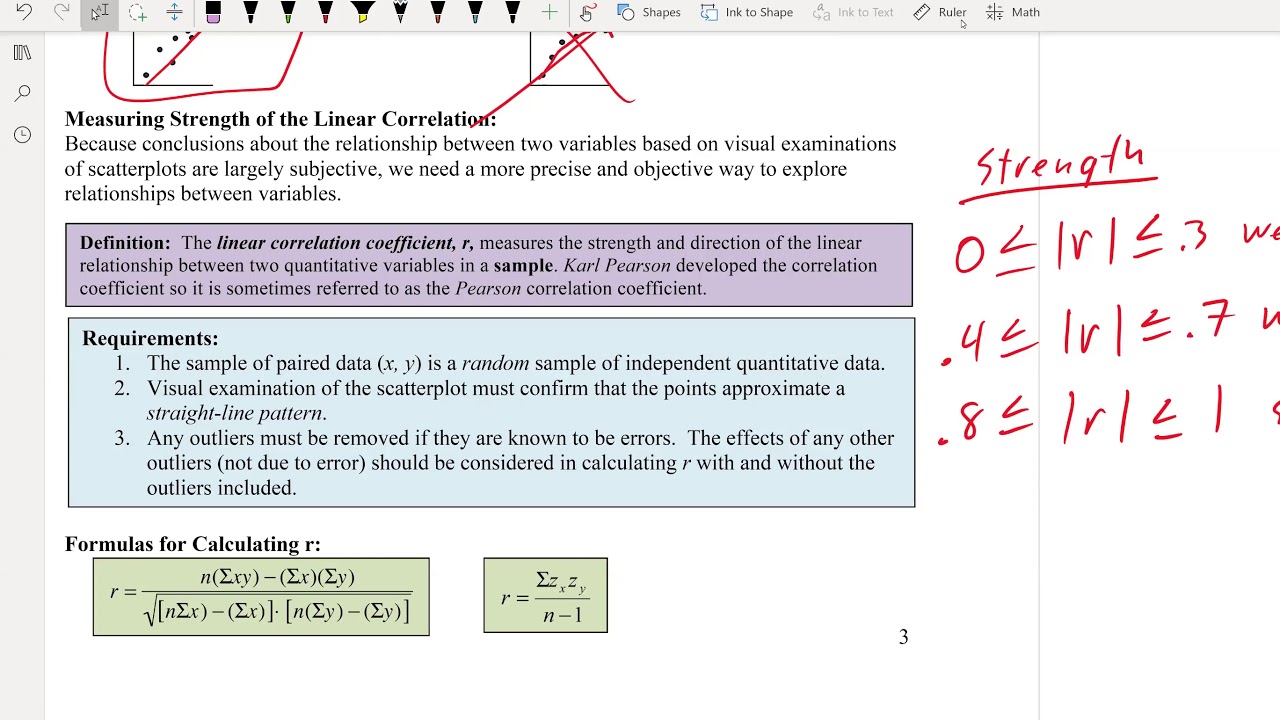
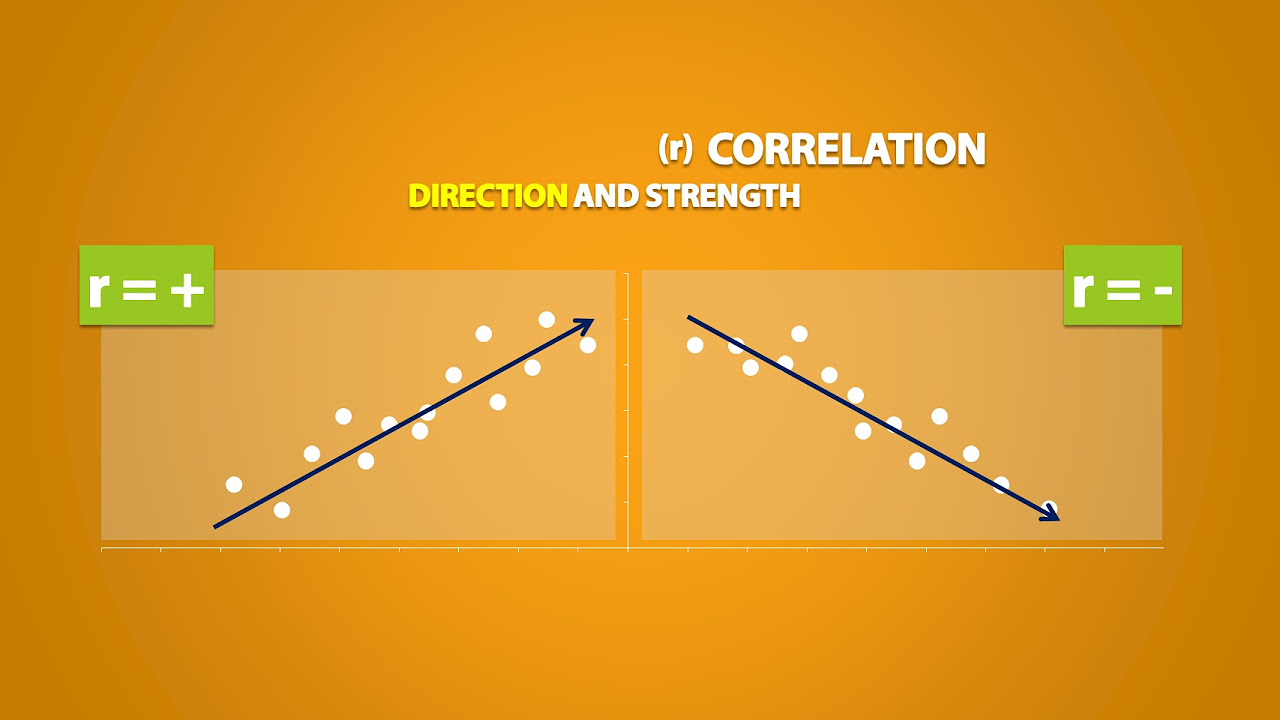
- 📊 The Pearson correlation coefficient, denoted by R, measures the strength and direction of a linear relationship between two variables, with values ranging from -1 to 1.
- 🔍 A correlation coefficient close to zero indicates no correlation, while values close to one or negative one indicate a strong positive or negative correlation, respectively.
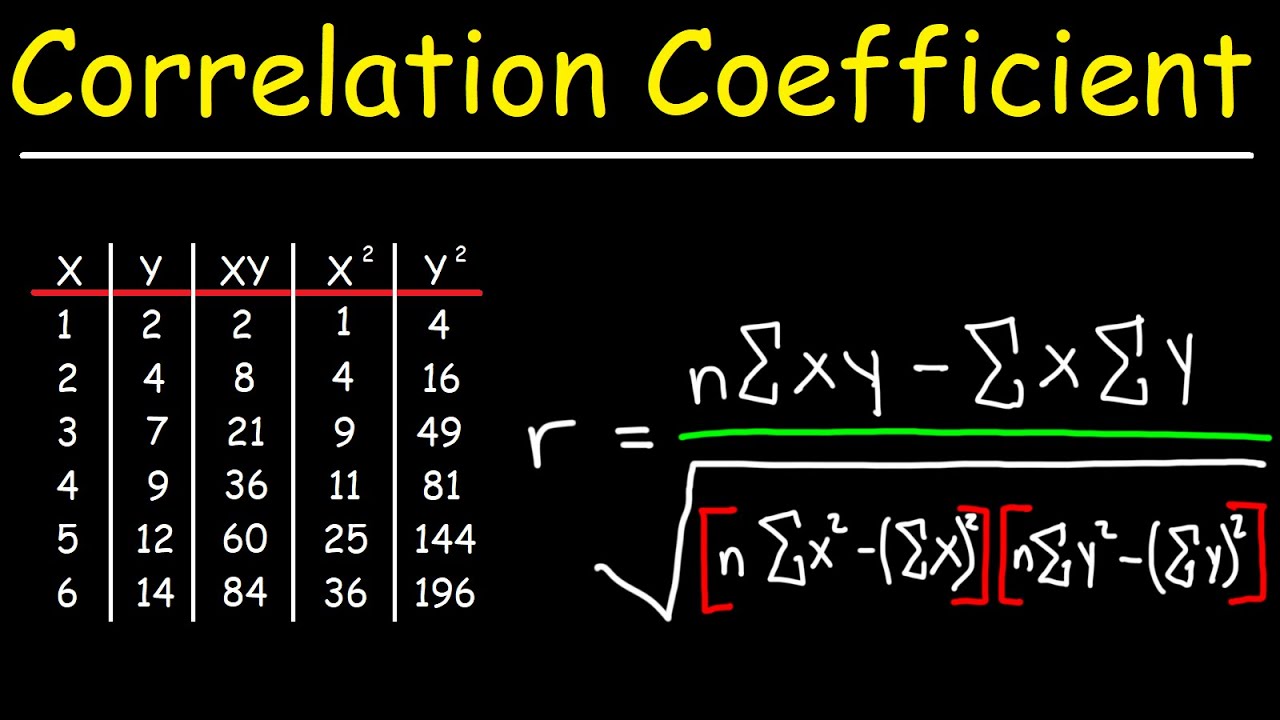
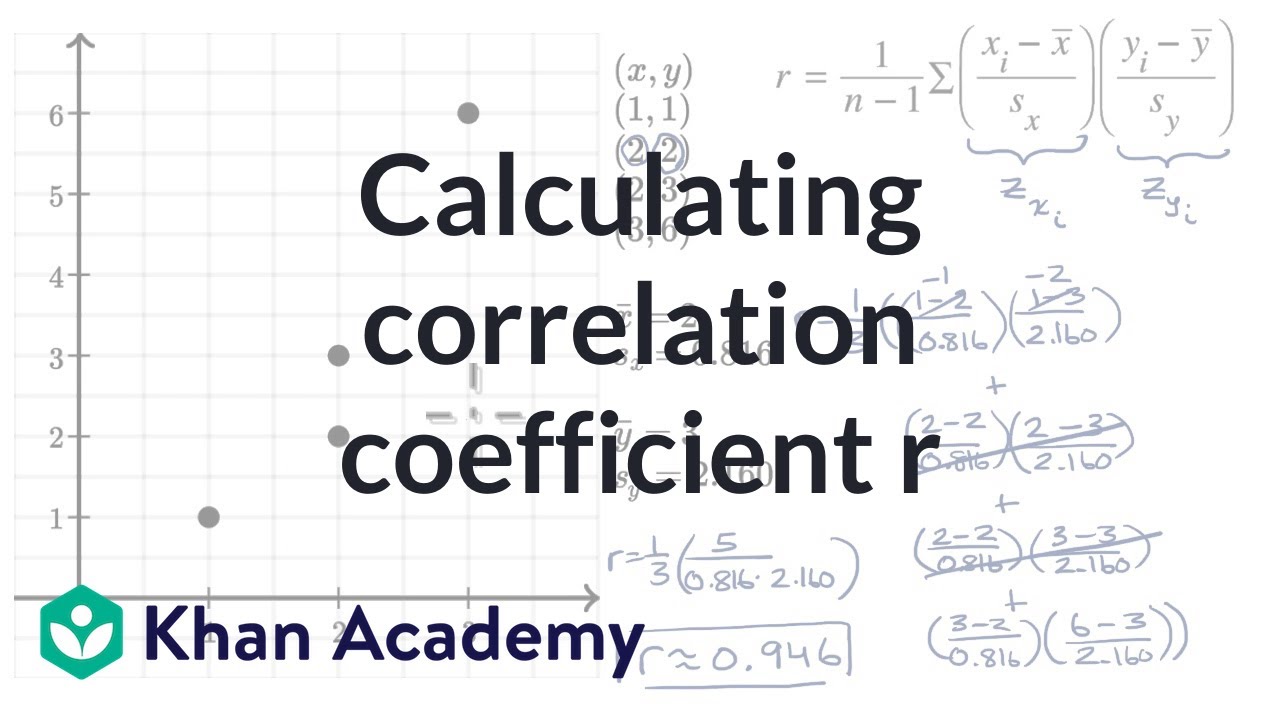
- 📈 The Pearson correlation is calculated by dividing the covariance of the two variables by the product of their standard deviations.
- 🔢 The covariance alone is not a useful metric; it is used in combination with other metrics like the correlation coefficient.
- 💯 The coefficient of determination, R square, is derived by squaring the Pearson correlation coefficient and measures the proportion of the variance in the dependent variable that is predictable from the independent variable.
- 📉 As R approaches negative one, R square approaches positive one, indicating that the squared value is positive regardless of the sign of R.
- 📌 R square is agnostic to the direction of the correlation, focusing on the existence of a relationship between variables.
- 🔑 Key points for R square include approaching zero for a weak relationship and approaching one for a strong relationship.
- 📚 The sum of squares plays a significant role in the Pearson correlation, particularly in the context of linear regression and comparing it to a simple average prediction.
- ⚖️ The R square value can be used to evaluate the effectiveness of a linear regression model by comparing it to the performance of a model that uses only the average of the dependent variable.
- 📘 The video concludes with a promotion of two books for further learning: 'Essential Math for Data Science' and 'Getting Started with SQL'.
Q & A
What is the Pearson correlation coefficient, denoted by R?
-The Pearson correlation coefficient, denoted by R, measures the strength and direction of a linear relationship between two variables, with a value ranging from -1 to 1.
What does a correlation coefficient of zero indicate about the relationship between two variables?
-A correlation coefficient of zero indicates that there is no linear correlation between the two variables.
How does a correlation coefficient close to one signify the relationship between variables?
-A correlation coefficient close to one indicates a strong positive correlation, meaning as one variable increases, the other also increases proportionally.
What does a correlation coefficient close to negative one represent?
-A correlation coefficient close to negative one represents a strong negative correlation, meaning as one variable increases, the other decreases proportionally.
What is the formula for calculating the Pearson correlation coefficient?
-The Pearson correlation coefficient is calculated by dividing the covariance between the two variables by the product of their standard deviations.
What is the coefficient of determination, and how is it related to the Pearson correlation coefficient?
-The coefficient of determination, denoted as R^2, is the square of the Pearson correlation coefficient (R). It measures the proportion of the variance in the dependent variable that is predictable from the independent variable(s).
Why is the coefficient of determination squared?
-The coefficient of determination is squared because squaring the correlation coefficient makes it positive, regardless of whether the relationship is positive or negative, and thus it only indicates the strength of the relationship.
How does the R^2 value indicate the strength of the relationship between variables?
-As R^2 approaches zero, it indicates a weak relationship, while as R^2 approaches one, it indicates a strong relationship between the variables.
What is the significance of the sum of squares in the context of Pearson correlation?
-The sum of squares is significant as it is used in calculating the coefficient of determination. It helps in determining the proportion of the variance in the dependent variable that is predictable from the independent variable.
How can the R^2 value be used to compare linear regression to a simple average?
-The R^2 value can be used to compare the effectiveness of a linear regression model to using a simple average for prediction by subtracting the ratio of the sum of squared residuals to the total sum of squares from 1.0.
What are the two O'Reilly books mentioned in the script that the viewer can support the channel with?
-The two O'Reilly books mentioned are 'Essential Math for Data Science' and 'Getting Started with SQL'.
Outlines
📊 Understanding the Pearson Correlation Coefficient
This paragraph introduces the Pearson correlation coefficient, denoted by R, which is a statistical measure that quantifies the strength of the linear relationship between two variables. The value of R ranges from -1 to 1, where values close to zero indicate no correlation, values closer to 1 suggest a strong positive correlation, and values near -1 imply a strong negative correlation. The paragraph also explains the concept of covariance and how it's used in conjunction with standard deviations to calculate the Pearson correlation coefficient. Key takeaways include understanding that as R approaches zero, one, or negative one, it indicates the absence, presence, or inverse of a correlation, respectively.
📈 Exploring the Coefficient of Determination (R Square)
The second paragraph delves into the coefficient of determination, known as R square, which is derived by squaring the Pearson correlation coefficient. R square measures the proportion of the variance in the dependent variable that is predictable from the independent variable(s). It scores between 0 and 1, with values approaching zero indicating a weak relationship and values nearing one suggesting a strong relationship. The paragraph also discusses the implications of R square in the context of linear regression, explaining how it can be used to compare the effectiveness of a regression model to a simple average prediction. The summary emphasizes the utility of R square in assessing the predictability of the relationship between variables, regardless of whether the correlation is positive or negative.
Mindmap
Keywords
💡Correlation Coefficient
💡Covariance
💡Standard Deviation
💡Coefficient of Determination
💡Linear Relationship
💡Residuals
💡Sum of Squares
💡Regression
💡Predictive Relationship
💡Three Minute Data Science
Highlights
The correlation coefficient, also known as the Pearson correlation, is denoted by R and measures the strength of the relationship between two variables on a scale from negative one to one.
A correlation coefficient close to zero indicates no correlation between variables.
A coefficient close to one signifies a strong positive correlation, meaning variables increase proportionally.
A coefficient close to negative one indicates a strong negative correlation, with one variable increasing as the other decreases proportionally.
The covariance between variables is used in the calculation of the Pearson correlation coefficient but is not meaningful on its own.
The coefficient of determination, or R square, is the squared value of R and measures the impact of the input variable on the output variable, scoring between 0 and 1.
R square indicates the predictability of the relationship between input and output variables based on their variation.
When R approaches negative one, R square approaches positive one, reflecting the squaring of a negative number.
R square is agnostic to the direction of the correlation, focusing on the presence of a relationship.
As R square approaches zero, it indicates a weak relationship, while approaching one indicates a strong relationship.
The sum of squares plays a crucial role in the Pearson correlation and is used to compare linear regression effectiveness.
Linear regression can be compared to a simple average prediction by calculating the sum of squared residuals and subtracting from 1.0 to obtain R square.
The video provides a concise explanation of correlation and the coefficient of determination in three minutes.
The video concludes with a call to action to support the channel and mentions two O'Reilly books for further reading.
Essential Math for Data Science and Getting Started with SQL are recommended resources for viewers interested in data science and SQL.
The video encourages viewers to like, share, and subscribe for more content on data science.
Transcripts

5.0 / 5 (0 votes)
Thanks for rating: