Adjusted R Squared, Clearly Explained
TLDRThis tutorial delves into the concept of Adjusted R-squared in model evaluation, contrasting it with the traditional R-squared. It explains the inherent issue with R-squared's tendency to increase with the addition of new variables, regardless of their relevance, due to the Ordinary Least Squares method minimizing the residual sum of squares. The video introduces Adjusted R-squared as a solution, which penalizes the inclusion of extra variables, ensuring they significantly improve the model's fit to justify their addition.
Takeaways
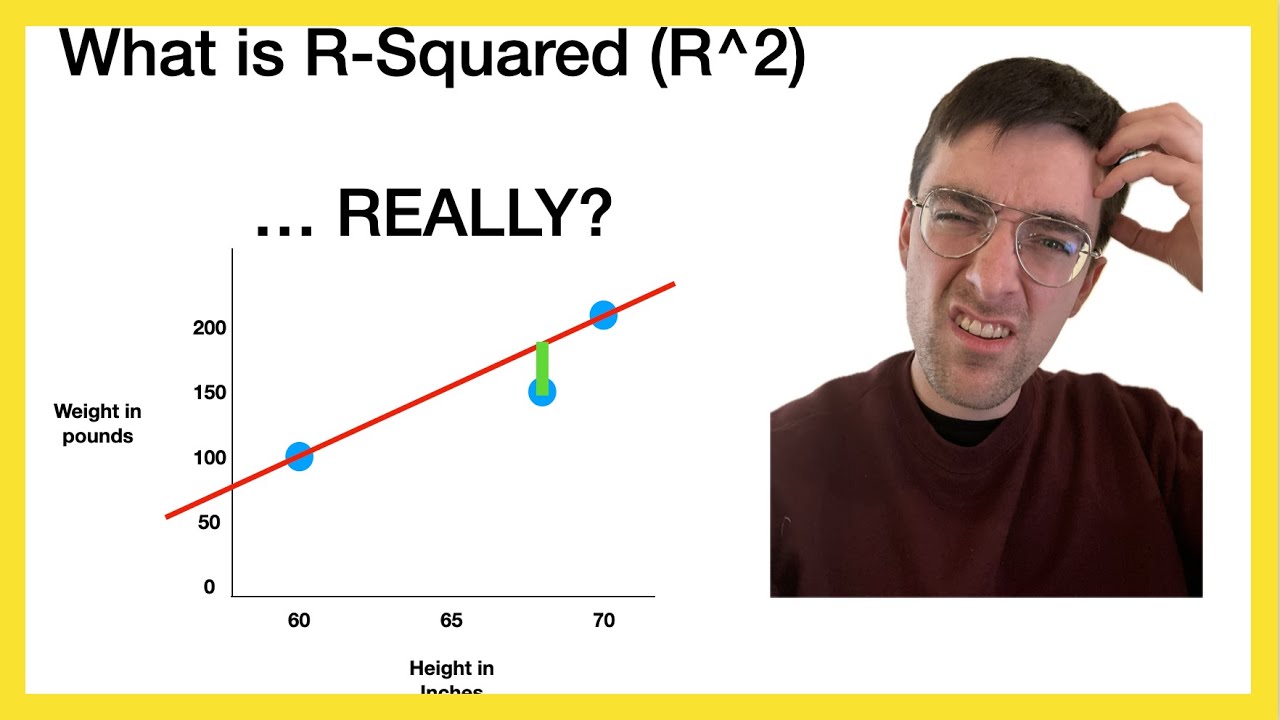
- 📊 R-squared is a measure of how well the regression predictions approximate the real data points, with values ranging from 0 to 1, where higher values are generally better.
- 🔍 There is no universal rule for what constitutes a 'good' R-squared value; it varies depending on the industry and specific use case.
- ⚠️ Adding new independent variables to a model can lead to an increase in R-squared, but this doesn't always mean the model is better, as it can include variables that don't contribute meaningfully to the model's accuracy.
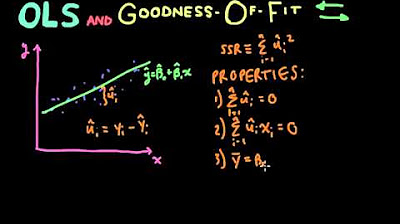
- 🔧 The Ordinary Least Squares (OLS) method minimizes the residual sum of squares, which can lead to the inclusion of variables that don't actually improve predictions.
- 📉 When a new variable is added, the total sum of squares remains constant, but the residual sum of squares can only decrease or stay the same, potentially misleadingly increasing R-squared.
- 💡 Adjusted R-squared is introduced to address the issue of overfitting by penalizing the addition of variables that do not significantly improve the model's predictive power.
- 📐 The formula for Adjusted R-squared includes the number of independent variables (K) and the sample size (N), with the penalty increasing as more variables are added.
- 📉 Adjusted R-squared decreases as more variables are added to the model, reflecting the penalty for unnecessary complexity.
- 🔑 The value of K in the Adjusted R-squared formula is crucial, as it directly affects the penalty applied for adding more variables.
- 🚀 Adjusted R-squared encourages model simplicity and ensures that only variables that significantly improve the model are included.
- 📚 The tutorial emphasizes the importance of understanding and correctly applying Adjusted R-squared to build more accurate and reliable regression models.
Q & A
What is the basic definition of R-squared in the context of model evaluation?
-R-squared is defined as 1 minus the ratio of the residual sum of squares to the total sum of squares. It measures the proportion of the variance in the dependent variable that is predictable from the independent variables. A higher R-squared value indicates a better fit of the model.
Why is there no universal rule of thumb for R-squared values?
-There is no universal rule of thumb for R-squared values because what constitutes a 'good' R-squared depends on the industry and the specific use case. In some cases, an R-squared of 0.9 might be excellent, while in others, an R-squared of 0.4 might be more appropriate.
What happens to the total sum of squares when a new independent variable is added to a linear regression model?
-When a new independent variable is added to a linear regression model, the total sum of squares does not change. This is because it is dependent only on the average of the actual Y values and not on the predicted Y values (y-hat).
Why can't the residual sum of squares increase when a new variable is added to the model?
-The residual sum of squares cannot increase when a new variable is added because the ordinary least squares method, which is used to build models, aims to minimize this value. If adding a variable does not improve the predictions, the method will set the coefficient for that variable to zero, leaving the residual sum of squares unchanged.
What is the problem with always increasing R-squared when adding new variables?
-The problem with always increasing R-squared when adding new variables is that it may lead to overfitting, where the model becomes too complex and includes variables that do not actually contribute to the predictive power of the model. This can make the model less generalizable to new data.
What is Adjusted R-squared and why is it used?
-Adjusted R-squared is a modified version of R-squared that includes a penalty term for the number of independent variables (K) in the model. It is used to prevent overfitting by discouraging the addition of variables that do not significantly improve the model's predictive power.
How does the Adjusted R-squared formula penalize the addition of new variables?
-The Adjusted R-squared formula penalizes the addition of new variables by including a term that is inversely proportional to the number of independent variables (K) and the sample size (N). As more variables are added, the penalty term increases, which can decrease the Adjusted R-squared value if the improvement in R-squared is not substantial enough.
What is the significance of the coefficient B3 in the context of adding a new variable to a model?
-The coefficient B3 represents the effect of the newly added variable (X3) on the predicted values. If B3 is found to improve the predictions, the residual sum of squares decreases, and R-squared increases. If no improvement is found, the ordinary least squares method may set B3 to zero, effectively ignoring the new variable.
How does the ordinary least squares method handle a situation where adding a new variable does not improve predictions?
-In a situation where adding a new variable does not improve predictions, the ordinary least squares method will set the coefficient for that variable to zero. This means the new variable does not contribute to the model's predictions, and the residual sum of squares remains unchanged.
What should be the criterion for adding a new variable to a model according to Adjusted R-squared?
-According to Adjusted R-squared, a new variable should only be added to a model if the increase in the original R-squared value is substantial enough to compensate for the penalty imposed by the addition of the variable. This ensures that the variable adds significant value to the model's predictive power.
Outlines
📈 Adjusted R-Squared: The Problem with Adding Variables
This paragraph discusses the concept of adjusted R-squared in the context of model evaluation. It begins by explaining the traditional R-squared, which measures the proportion of the variance in the dependent variable that is predictable from the independent variables. The speaker highlights that R-squared values are industry and use-case dependent, with no fixed rule of thumb. The main issue addressed is the tendency of R-squared to increase when additional independent variables are added to a model, regardless of their relevance. This is due to the nature of the ordinary least squares method, which minimizes the residual sum of squares, potentially leading to overfitting. The speaker explains that adding variables can decrease the residual sum of squares, thus increasing R-squared, even when the new variables do not contribute meaningfully to the model. The paragraph concludes by introducing adjusted R-squared as a solution to this problem, which penalizes the addition of variables that do not significantly improve the model's predictive power.
🔍 Understanding Adjusted R-Squared and Its Importance
The second paragraph delves deeper into the concept of adjusted R-squared, emphasizing its role in ensuring that variables added to a model provide substantial improvements. The speaker explains that adjusted R-squared incorporates a penalty for adding more independent variables, as indicated by the formula involving the number of variables (K) and the sample size (N). This penalty ensures that the addition of a new variable must result in a significant increase in the original R-squared to be considered worthwhile. The paragraph underscores the importance of justifying the inclusion of new variables based on their contribution to the model's predictive accuracy. The speaker concludes by summarizing the tutorial on adjusted R-squared and hints at future content in a playful manner, using a German learning reference to suggest a break or transition to another topic.
Mindmap
Keywords
💡R-squared
💡Adjusted R-squared
💡Linear Regression
💡Residual Sum of Squares (RSS)
💡Total Sum of Squares (TSS)
💡Ordinary Least Squares (OLS)
💡Coefficient
💡Overfitting
💡Variable
💡Sample Size (N)
💡Goodness of Fit
Highlights
Adjusted R-squared is introduced as a measure to evaluate model performance, addressing the issue of adding new independent variables.
R-squared is defined as 1 minus the ratio of residual sum of squares to total sum of squares, indicating model fit with a range between 0 and 1.
There is no universal rule of thumb for R-squared values, as they depend on the industry and use case.
Adding a new independent variable to a linear regression model does not change the total sum of squares but can decrease the residual sum of squares.
The ordinary least squares method minimizes the residual sum of squares, which can lead to an increase in R-squared when adding variables.
The problem with R-squared is that it can increase even when adding variables that do not contribute to the model's predictive power.
Adjusted R-squared is calculated with a formula that includes the number of independent variables (K) and the sample size (N).
Adjusted R-squared penalizes the addition of variables by decreasing as K increases, thus discouraging the inclusion of irrelevant variables.
The adjusted R-squared formula rewards substantial increases in R-squared that compensate for the penalty of adding more variables.
Adding new variables should be justified by a significant improvement in the model's R-squared to be considered worthwhile.
The tutorial emphasizes the importance of adding variables only when they bring substantial improvement to the model.
The ordinary least squares method can set a variable's coefficient to zero if it does not improve predictions, effectively ignoring the variable.
The tutorial provides a practical guide on how to calculate and interpret adjusted R-squared.
Adjusted R-squared is a refinement over traditional R-squared to prevent overfitting by considering the number of variables in the model.
The tutorial explains the concept of overfitting and how adjusted R-squared helps in avoiding models with too many irrelevant variables.
The importance of industry and use case context in interpreting R-squared values is reiterated for a nuanced understanding.
The tutorial concludes with a reminder of the significance of adjusted R-squared in model evaluation and its practical applications.
Transcripts


5.0 / 5 (0 votes)
Thanks for rating: