Curve Sketching - Graphing Functions Using Derivatives | Calculus
TLDRThis video tutorial delves into the art of curve sketching for polynomial functions, emphasizing the importance of understanding the first and second derivatives. It illustrates how the sign of these derivatives can indicate the concavity and the increasing or decreasing nature of the function. By using sign charts and analyzing critical points, one can predict the general shape of the graph. The video provides step-by-step examples, including finding x-intercepts and plotting the function, to demonstrate how to combine these concepts into a coherent sketch of the polynomial function's graph.
Takeaways
- 📈 Understanding curve sketching for polynomial functions involves recognizing four fundamental shapes based on the first and second derivatives.
- 📌 A concave down shape indicates a negative second derivative, typically forming a 'U' shape that points downwards.
- 📌 A concave up shape corresponds to a positive second derivative, which looks like an upside-down 'U'.
- 🚀 The first derivative's sign reflects the function's increase or decrease: positive for increasing functions and negative for decreasing ones.
- 🔍 To graph a polynomial, first find the x-intercepts by setting the function equal to zero and factoring.
- ✍️ The first derivative can be factored to find critical points, which are where the function changes from increasing to decreasing or vice versa.
- 📊 Creating a sign chart for the first derivative helps identify where the function is increasing or decreasing.
- 📈 For the second derivative, setting it equal to zero helps find potential inflection points, which affect the graph's concavity.
- 🔄 Combining the sign charts of the first and second derivatives allows for a comprehensive sketch of the polynomial function's graph.
- 📐 The process of curve sketching involves plotting critical points, inflection points, and x-intercepts to form the graph's overall shape.
- 🛠️ Additional examples and practice are recommended to solidify understanding and application of the principles of curve sketching for polynomial functions.
Q & A
What are the four fundamental shapes for curve sketching in polynomial functions?
-The four fundamental shapes for curve sketching are those determined by the signs of the first and second derivatives. These shapes are: concave up with both first and second derivatives positive, concave down with both first and second derivatives negative, increasing with the first derivative positive and the second derivative negative, and decreasing with the first derivative negative and the second derivative positive.
How can you determine if a shape is concave up or concave down?
-A shape is concave up if the second derivative is positive, indicating that the curve is bending upwards. Conversely, a shape is concave down if the second derivative is negative, meaning the curve is bending downwards.
What does the sign of the first derivative indicate about the function's increase or decrease?
-The sign of the first derivative indicates whether the function is increasing or decreasing. If the first derivative is positive, the function is increasing. If the first derivative is negative, the function is decreasing.
How do you find the x-intercepts of a polynomial function?
-To find the x-intercepts of a polynomial function, set the function equal to zero and solve for x. The solutions represent the x-values where the graph crosses or touches the x-axis.
What is the process for sketching a polynomial function using its derivatives?
-The process involves finding the x-intercepts, calculating the first and second derivatives, identifying critical points by setting the derivatives equal to zero, creating sign charts for the first and second derivatives to determine the intervals of increase/decrease and concavity, and then combining this information to sketch the curve.
What is the significance of the first and second derivatives in creating a sign chart?
-The first derivative sign chart helps identify where the function is increasing or decreasing, while the second derivative sign chart indicates the concavity of the function. Together, they provide a clear picture of the graph's behavior and shape.
How do you find the critical points of a polynomial function?
-Critical points are found by setting the first derivative of the function equal to zero and solving for x. These points are where the function may have local maximums, local minimums, or points of inflection.
What is the role of the graph's x-intercepts in curve sketching?
-The x-intercepts are the points where the graph crosses the x-axis. They are significant in curve sketching as they define the intervals over which the function is being analyzed and are often points of reference for the graph's behavior.
How can you identify inflection points on a curve?
-Inflection points can be identified by setting the second derivative equal to zero and solving for x. These points are where the concavity of the curve changes, transitioning from concave up to concave down or vice versa.
What is the importance of combining the sign charts of the first and second derivatives?
-Combining the sign charts of the first and second derivatives allows you to understand both the direction of the function's growth (increasing/decreasing) and the shape of the curve (concave up/down). This combination is essential for accurately sketching the curve and predicting its behavior.
What additional resources are available for learning about curve sketching?
-For further learning, there are additional resources such as other videos and materials that cover curve sketching with more examples and extended discussions on the topic. These resources can provide extra practice and deepen understanding of the principles involved.
Outlines
📚 Introduction to Curve Sketching and Derivatives
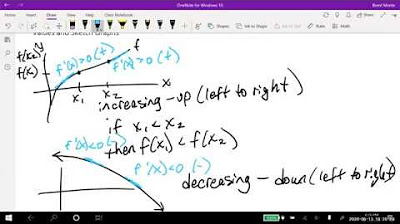
This paragraph introduces the concept of curve sketching, particularly for polynomial functions. It emphasizes the importance of understanding the four fundamental shapes of curves and their relation to the first and second derivatives. The explanation begins with the second derivative, describing how a concave down shape indicates a negative second derivative and a concave up shape indicates a positive second derivative. The first derivative's role is also discussed, noting that it is positive when the function is increasing and negative when the function is decreasing. The paragraph sets the stage for the detailed analysis of a specific polynomial function by illustrating how to create a sign chart for the first and second derivatives to predict the graph's appearance.
📈 Polynomial Function Analysis and X-Intercepts
In this paragraph, the video script delves into the analysis of a specific polynomial function, f(x) = x^3 + 6x^2 + 9x. The process of finding the x-intercepts is outlined, starting with factoring out the greatest common factor (GCF). The x-intercepts are determined to be 0 and -3. The first derivative of the function is calculated, and after factoring, the critical points are identified as -3 and -1. A sign chart for the first derivative is created, indicating where the function is increasing or decreasing. The paragraph also introduces the concept of potential maximum and minimum points, as well as inflection points, setting up the groundwork for sketching the curve.
📊 Sketching the Curve and Identifying Inflection Points
This paragraph focuses on the actual sketching of the curve based on the first and second derivatives. The second derivative is calculated, and potential inflection points are identified. The sign chart for the second derivative is created, which, when combined with the first derivative's sign chart, helps to determine the concavity of the graph. The paragraph describes how to draw the shape of the curve by combining the four sections corresponding to the sign charts, taking into account the concavity and the increasing/decreasing nature of the function. The process results in a rough sketch of the polynomial function's graph, highlighting the maximum at x = -3 and the minimum at x = -1.
🔍 Further Analysis with Another Polynomial Function
The paragraph continues the curve sketching process with another polynomial function, y = 3x^4 + 4x^3. The x-intercepts are found, and the first and second derivatives are calculated to identify the critical points and potential inflection points. The sign chart for the first derivative is created, revealing a minimum at x = -1. The second derivative's sign chart is also constructed, providing information about the concavity of the graph. The paragraph concludes with the combination of the sign charts to sketch the curve, identifying the minimum at x = -1 and a horizontal tangent at x = 0.
🎓 Conclusion and Additional Resources for Curve Sketching
The final paragraph wraps up the video by summarizing the process of using the first and second derivatives to sketch the graph of a polynomial function. It reiterates the importance of understanding the relationship between the derivatives and the shape of the curve. The video script also mentions additional resources, such as another video on curve sketching with more examples, for those who wish to further practice this mathematical topic. The paragraph ends by encouraging viewers to apply the principles learned to sketch the graph of any polynomial function.
Mindmap
Keywords
💡Curve Sketching
💡Polynomial Functions
💡First Derivative
💡Second Derivative
💡Critical Points
💡Sign Chart
💡Concavity
💡X-Intercepts
💡Inflection Points
💡Maxima and Minima
💡Factoring
Highlights
The video discusses basic examples of curve sketching, particularly for polynomial functions.
There are four fundamental shapes to be familiar with in curve sketching.
A concave down shape indicates a negative second derivative.
A concave up shape indicates a positive second derivative.
The first derivative is positive when the graph is going up and negative when going down.
Creating a sign chart for the first and second derivative helps to understand the graph's appearance.
The video provides an example of plotting a polynomial function f(x) = x^3 + 6x^2 + 9x.
The x-intercepts of the polynomial function are 0 and -3.
The first derivative of the function is 3x^2 + 12x + 9, and the critical points are -3 and -1.
The video demonstrates creating a sign chart for the first derivative, showing increasing and decreasing sections.
The second derivative of the function is 6x + 12, with a potential inflection point at -2.
Combining the sign charts for the first and second derivatives helps to sketch the curve.
The video illustrates the process of sketching the curve by combining four fragments into one graph.
The general shape of the graph is determined by the maximum at -3 and the minimum at -1.
Another example is given with the function y = 3x^4 + 4x^3, including finding x-intercepts and critical points.
The first derivative of the second example is 12x^3 + 12x^2, with a minimum at x = -1.
The second derivative of the second example is 36x^2 + 24x, with points of interest at x = 0 and x = -2/3.
The video concludes by showing how to combine the sign charts and sketch the curve for the second example.
The video encourages further practice with curve sketching and refers to another video with more examples.
Transcripts
Browse More Related Video

Curve Sketching - First & Second Derivatives - Graphing Rational Functions & Asymptotes - Calculus
Math 11 - Section 3.1
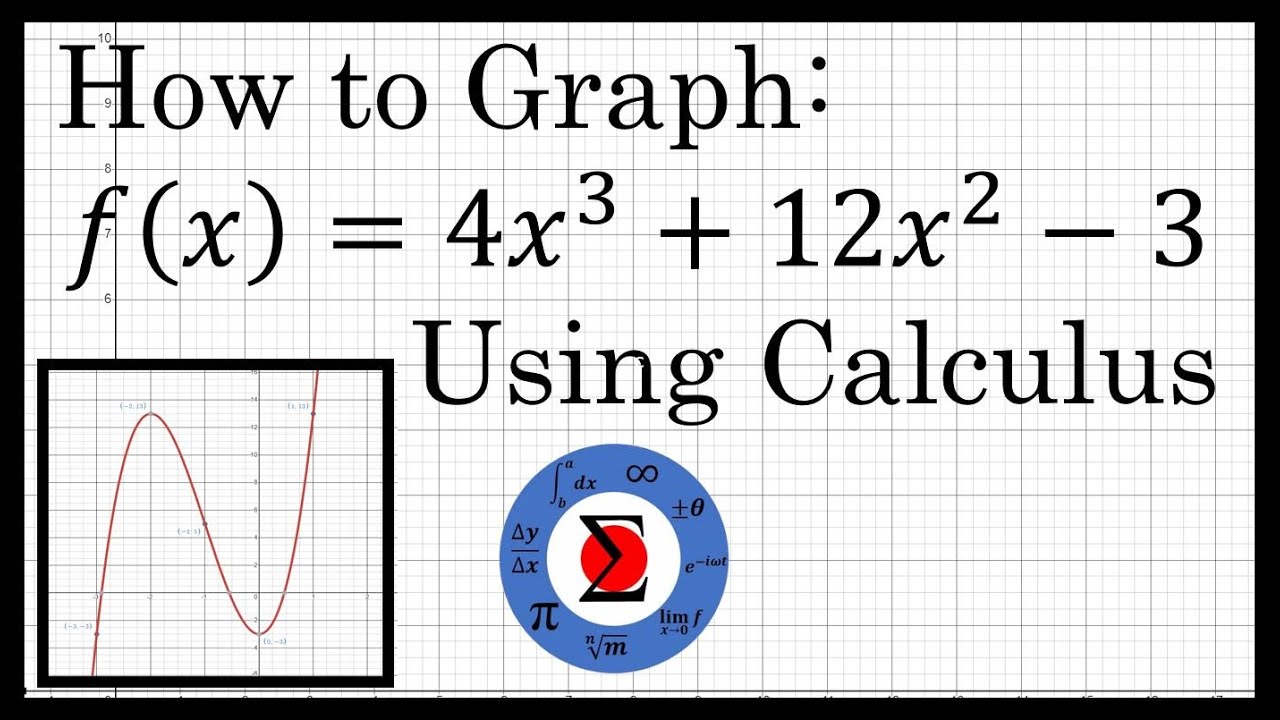
Graphing a Polynomial Equation :: Curve Sketching Using Calculus

Calculus 1 Lecture 3.6: How to Sketch Graphs of Functions
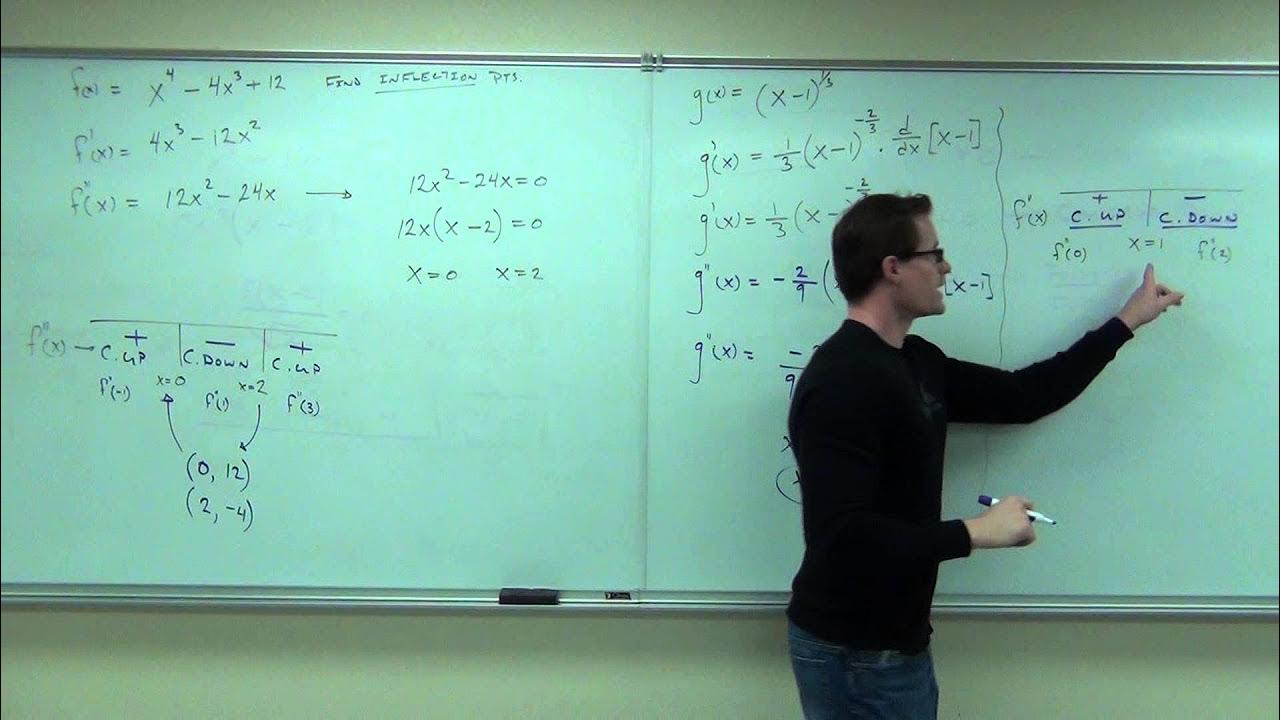
Calculus 1 Lecture 3.4: The Second Derivative Test for Concavity of Functions
Calculus AB Homework 4.6: Relationship between f, f', and f''
5.0 / 5 (0 votes)
Thanks for rating: