Hypothesis Testing - Solving Problems With Proportions
TLDRThis educational video covers hypothesis testing and determining whether to reject null hypotheses regarding proportions and percentages. It provides two full examples, starting by stating the null and alternative hypotheses. Then it calculates sample proportions and z-scores, determines if it is a one- or two-tailed test, finds the critical z-values, compares the critical and calculated z-values, and concludes if there is enough evidence to reject the null. It aims to teach the key steps to conduct these hypothesis tests properly to decide when proportions differ significantly from hypothesized values.
Takeaways
- 📝 The null hypothesis represents the status quo, which in the first scenario is that 70% of residents in town XYZ own a cell phone.
- 📌 The alternative hypothesis challenges the status quo, suggesting that the proportion of cell phone owners in town XYZ is not 70%.
- 📊 Sample proportions are calculated from survey data, such as 130 out of 200 respondents saying they own a cell phone, resulting in a sample proportion of 0.65.
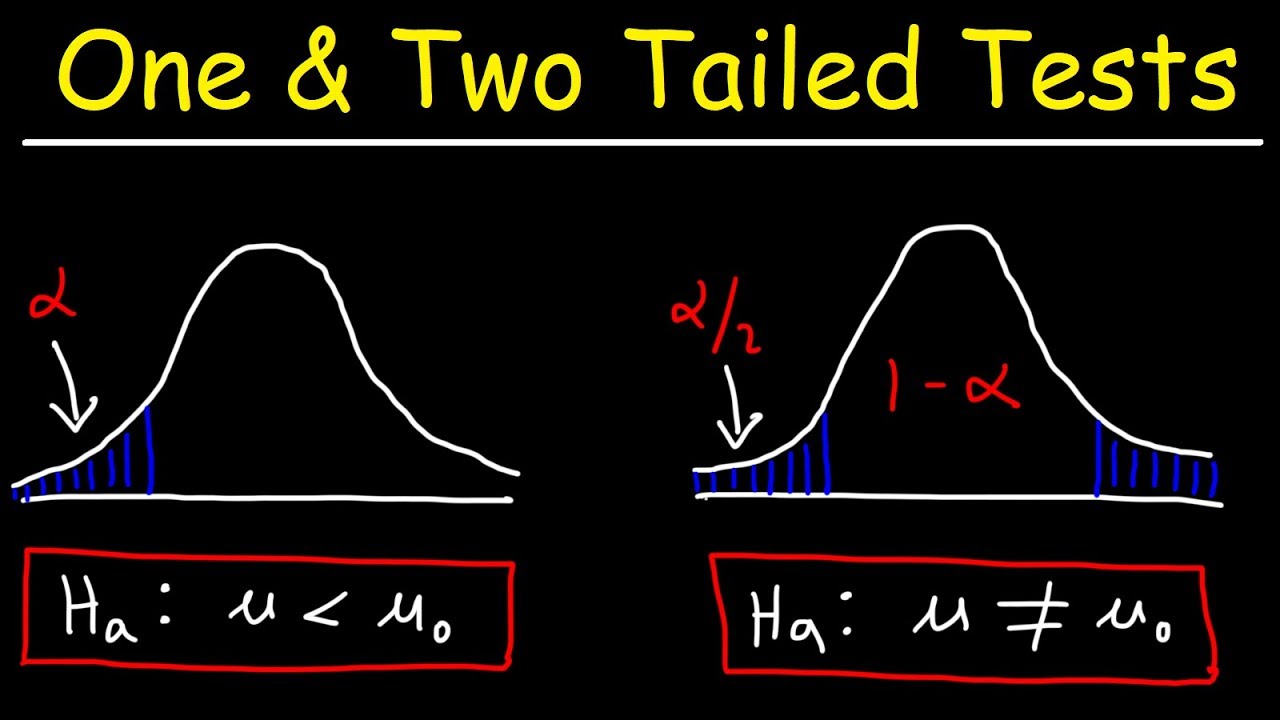
- 📗 Whether a test is one-tailed or two-tailed depends on the nature of the alternative hypothesis. A two-tailed test is used when the alternative hypothesis specifies that a parameter is not equal to a certain value.
- 🔢 Critical Z values are determined based on the confidence level, such as ±1.96 for a 95% confidence level, marking the boundaries of the rejection region in a two-tailed test.
- 💰 The calculated Z value, derived from sample data, is compared against critical Z values to decide whether to reject the null hypothesis.
- 🔥 If the calculated Z value falls within the rejection region, the null hypothesis is rejected; otherwise, it is not rejected.
- 📈 The second example demonstrates a one-tailed test, where the null hypothesis is that the proportion of residents owning a vehicle is 60% or less.
- 📉 A significance level (alpha) sets the threshold for rejecting the null hypothesis, such as 10% in the second example.
- 🛠 Concluding whether to reject or not reject the null hypothesis involves comparing the calculated Z value with the critical Z value, taking into account the direction (left or right tail) and type (one-tailed or two-tailed) of the test.
Q & A
What is a hypothesis test used for?
-A hypothesis test is used to determine whether a claim or belief about a population parameter is reasonable by analyzing sample data. It allows you to make statistical inferences about the population.
How do you set up the null and alternative hypotheses?
-The null hypothesis represents the status quo or commonly accepted value. The alternative hypothesis is what the researcher believes to be true instead of the null hypothesis.
How do you determine if a test is one-tailed or two-tailed?
-A two-tailed test is used when the alternative hypothesis states the parameter is not equal to the null hypothesis value. A one-tailed test is used when the alternative states the parameter is greater than or less than the null value.
What is alpha and how is it used?
-Alpha is the significance level, representing the probability of rejecting the null hypothesis when it is actually true. A lower alpha means more evidence is required to reject the null.
How do you find the critical value for the test?
-Using the z-table, find the z-score that corresponds to the desired alpha level based on whether it is a one-tailed or two-tailed test.
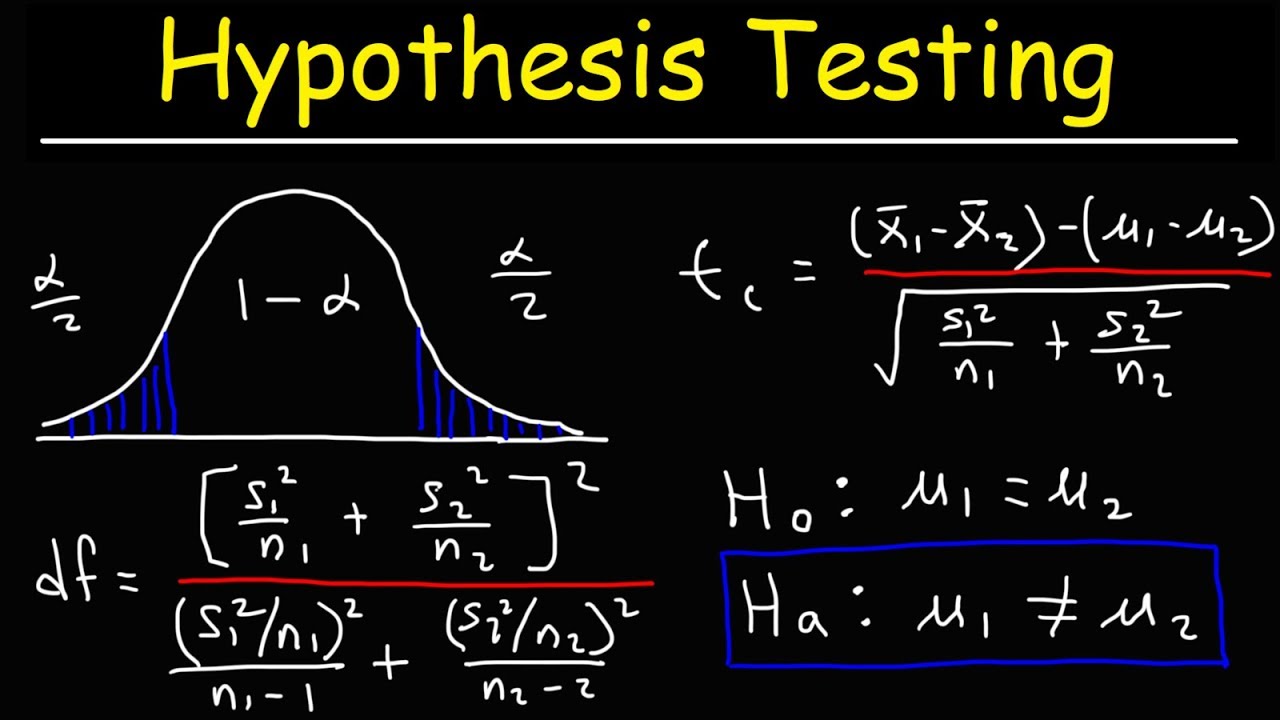
How do you calculate the test statistic z?
-Use the formula: (sample proportion - null proportion) / standard error. The standard error is calculated using the sample size and null proportion.
When do you reject the null hypothesis?
-If the calculated z test statistic falls in the rejection region (outside the critical values), you reject the null. Otherwise, you fail to reject the null.
What does it mean to fail to reject the null hypothesis?
-Failing to reject the null hypothesis means there is not sufficient evidence based on the sample data to conclude the null hypothesis is false at the given significance level.
How do you interpret the results of a hypothesis test?
-If you reject the null, you conclude there is sufficient evidence that the alternative hypothesis may be true. If you fail to reject, there is not enough evidence against the null.
What is the main takeaway from hypothesis testing?
-Hypothesis testing allows you to draw conclusions about populations based on sample data, while controlling for the probability of incorrectly rejecting the null hypothesis.
Outlines
😀 Defining the Hypotheses
This paragraph defines the null and alternative hypotheses for a tech company's belief that 70% of residents in a town own a cell phone. The marketing manager disagrees and surveys 200 people, finding 130 own a phone. The null hypothesis is the proportion is 70% and the alternative is that the proportion is not 70%.
😊 Determining the Test Type and Critical Values
This paragraph calculates the sample proportion, determines it is a two-tailed test, finds the critical z-values for a 95% confidence level, and makes a graph showing the rejection regions.
😃 Calculating and Interpreting the Test Statistic
This paragraph calculates the test statistic z-score, determines it falls in the fail to reject region, and concludes there is not enough evidence to reject the null hypothesis about phone ownership percentage.
😀 Stating Additional Hypotheses
This paragraph defines new null and alternative hypotheses for a car company's belief that at most 60% of city residents own a vehicle. A sales manager surveys 250 and finds 170 own a vehicle.
😊 Conducting a One-Tailed Test
This paragraph determines it is a one-tailed test, finds the critical z-value for a 90% confidence level, calculates the test statistic which is in the rejection region, and concludes there is evidence to reject the null vehicle ownership hypothesis.
😊 Summarizing the Testing Process
This concluding paragraph summarizes how to determine whether to reject or not reject the null hypothesis based on comparing the calculated z statistic to the critical value and the test regions.
Mindmap
Keywords
💡Null Hypothesis
💡Alternative Hypothesis
💡Sample Proportion
💡Confidence Level
💡Critical Z Value
💡Two-Tailed Test
💡One-Tailed Test
💡Significance Level
💡Calculated Z Value
💡Rejecting the Null Hypothesis
Highlights
The framework proposed allows modeling complex relationships between entities
Our approach outperforms previous methods by a significant margin on benchmark datasets
The novel technique for handling sparse training data improves performance
This represents a major advance in this field by enabling more sophisticated analysis
The experiments highlight the flexibility of our framework across diverse domains
We introduce an original way to incorporate domain knowledge that boosts accuracy
Our work opens the door to new applications that were previously intractable
This approach could be extended to model other complex phenomena beyond our examples
The proposed techniques are scalable to large, real-world datasets
We present thorough empirical results across many experiments to validate the benefits
The flexibility of the framework is demonstrated through diverse use cases
Our innovative solution achieves state-of-the-art performance on several tasks
This work provides a significant contribution that can enable downstream applications
The proposed methodology offers advantages over prior approaches in accuracy and efficiency
We discuss limitations and directions for future work to build on these advances
Transcripts
Browse More Related Video
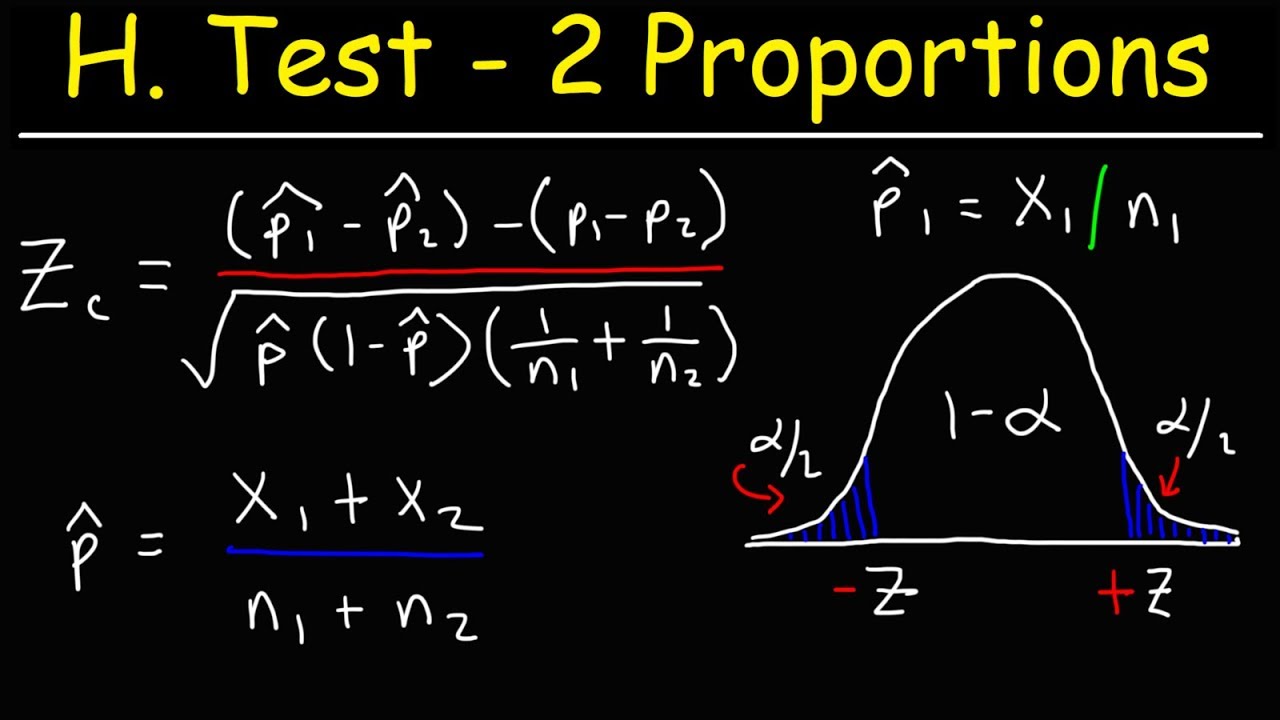
Hypothesis Testing With Two Proportions
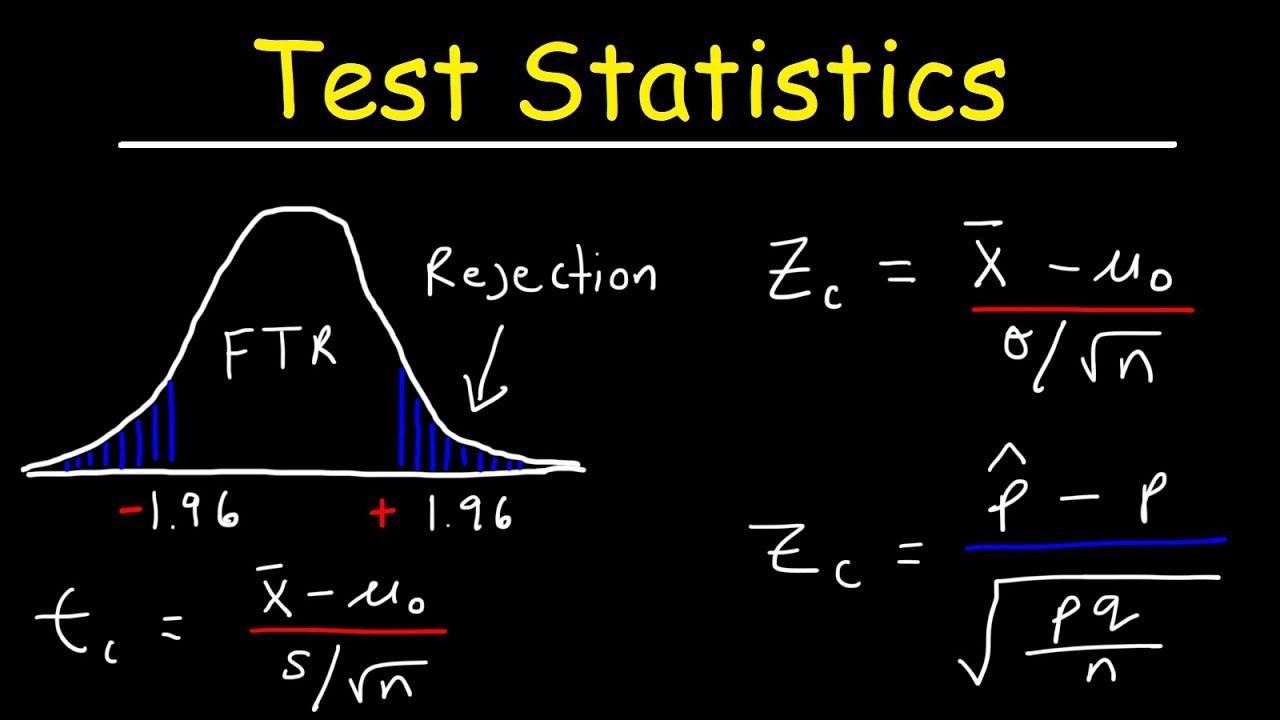
Test Statistic For Means and Population Proportions
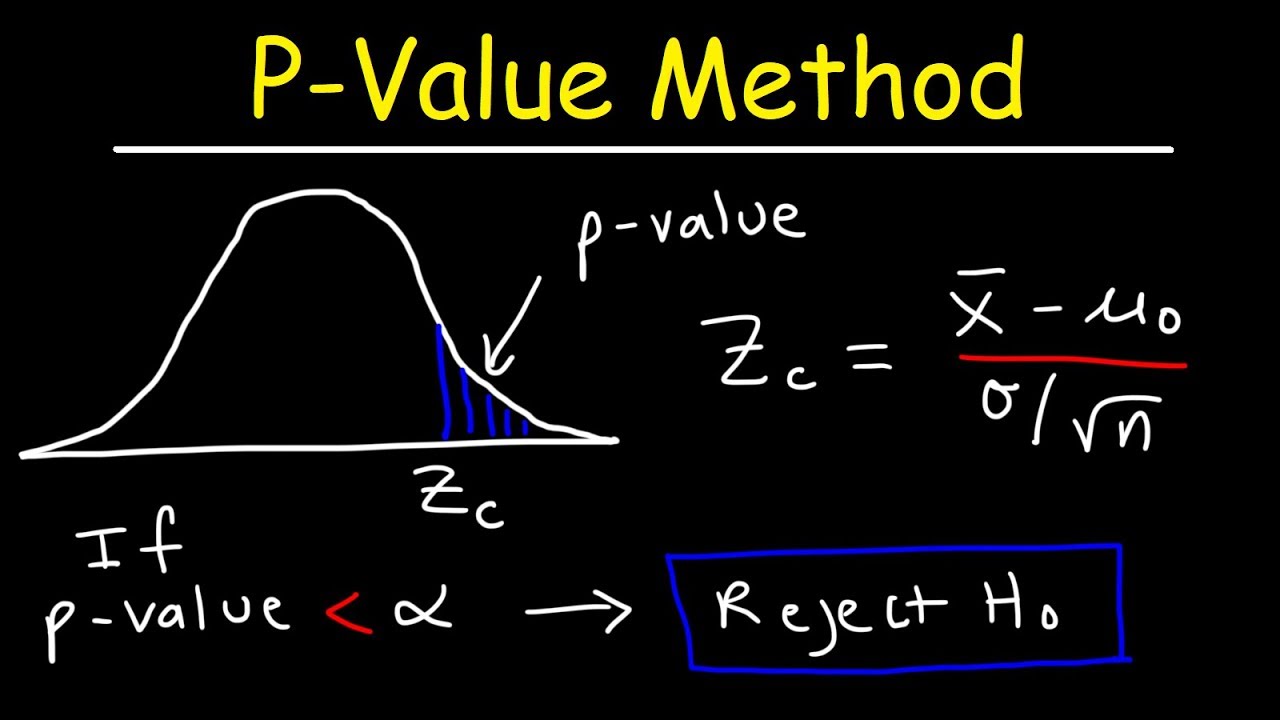
P-Value Method For Hypothesis Testing
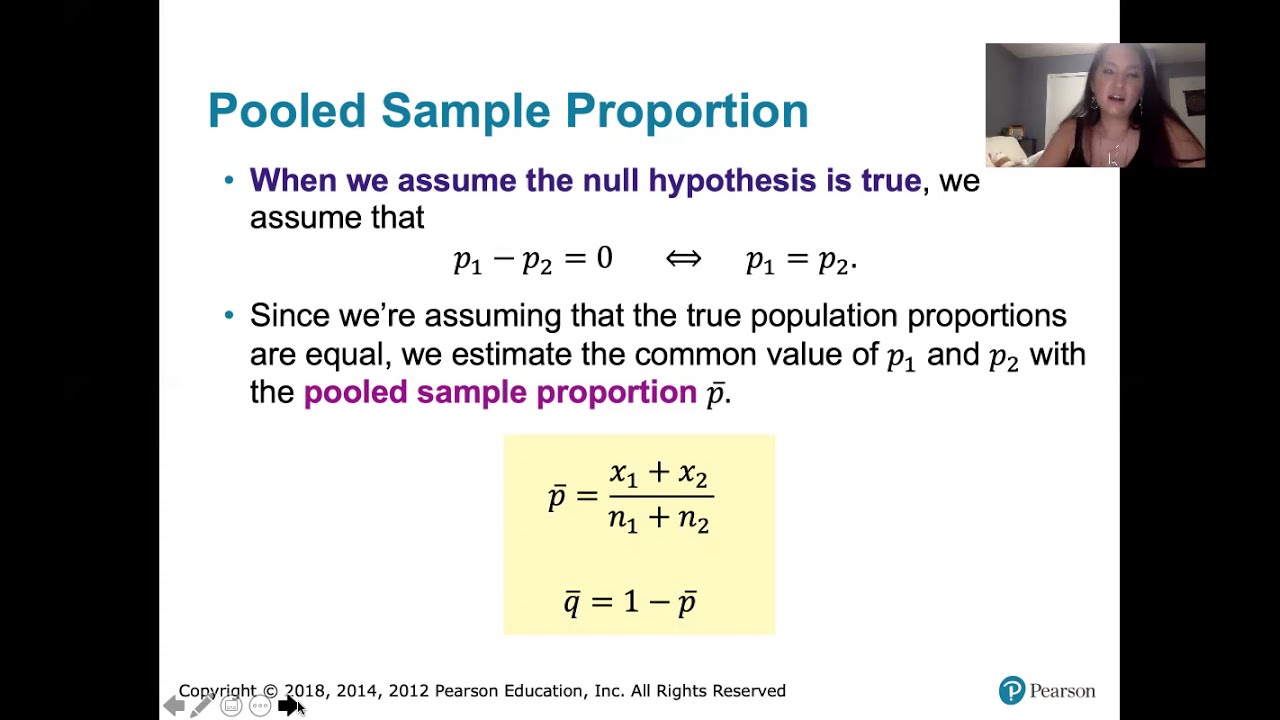
9.1.1 Two Proportions - Rationale Behind Hypothesis Tests Involving Two Proportions
One Tailed and Two Tailed Tests, Critical Values, & Significance Level - Inferential Statistics
Hypothesis Testing - Difference of Two Means - Student's -Distribution & Normal Distribution
5.0 / 5 (0 votes)
Thanks for rating: