P-Value Method For Hypothesis Testing
TLDRThis video explains how to determine whether to reject or fail to reject the null hypothesis using the p-value method. It provides two example problems, walking through the steps to state the null and alternative hypotheses, calculate the p-value based on sample statistics like mean and standard deviation, compare the p-value to the significance level alpha, and make a decision to reject or fail to reject the null. The video contrasts the p-value method with the traditional method of comparing calculated test statistics to critical values. It aims to teach the key concepts and calculations underlying hypothesis testing using clear explanations and worked examples.
Takeaways
- 😀 The video explains how to determine whether to reject or fail to reject the null hypothesis using the p-value method
- 😊 The null hypothesis assumes there is no difference between the true mean and the claimed mean
- 📝 Steps: State the null and alternative hypotheses, find the p-value, compare p-value to significance level alpha
- 📈 Use z-test if sample size is large (n≥30), use t-test if sample size is small
- 😉 p-value represents area under the curve corresponding to test statistic z or t
- 📊 If p-value < alpha, reject null hypothesis; if p-value ≥ alpha, fail to reject null hypothesis
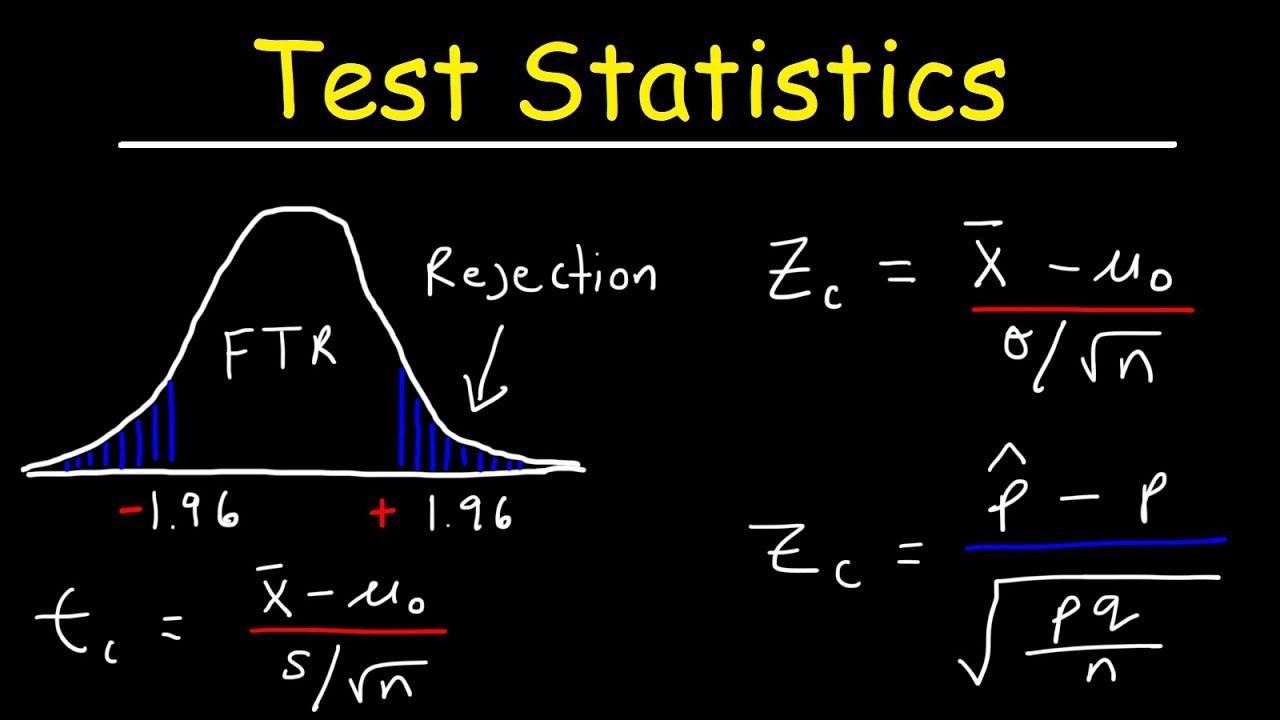
- 🧮 Calculate test statistic z using sample mean, null mean, sample standard deviation, sample size
- 📉 For left-tailed test, find p-value (area under curve to left) using z table
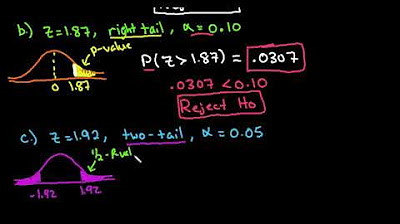
- 📈 For right-tailed test, find p-value (area under curve to right) using z table
- 🎓 Examples demonstrate how to apply p-value method for one-tailed and two-tailed test cases
Q & A
What is the null hypothesis in the first example problem?
-The null hypothesis is that the average weight of all residents in town XYZ is 168 pounds.
What is the alternative hypothesis in the second example problem?
-The alternative hypothesis is that the mean time to engine or transmission malfunction is less than 5 years.
What is the significance level in the first example problem?
-The significance level (alpha) in the first example problem is 0.05.
How do you calculate the p-value?
-To calculate the p-value, first find the calculated z-value or t-value. Then use the z-table or t-table to find the corresponding area under the normal curve. This area represents the p-value.
When should you use a one-tailed vs two-tailed test?
-Use a one-tailed test when the alternative hypothesis states that the mean is greater than or less than a specified value. Use a two-tailed test when the alternative states that the mean does not equal a specified value.
What does it mean to reject the null hypothesis?
-Rejecting the null hypothesis means concluding that there is enough evidence to support the alternative hypothesis.
When can you use a z-test instead of a t-test?
-You can use a z-test instead of a t-test when the sample size is 30 or more, or when the population standard deviation is known.
What should you do if the p-value is less than alpha?
-If the p-value is less than alpha, reject the null hypothesis.
What is the difference between confidence level and significance level?
-The confidence level represents the probability that the confidence interval contains the true population parameter value. The significance level (alpha) is the threshold for rejecting the null hypothesis.
How do the traditional method and p-value method for hypothesis testing differ?
-The traditional method compares the calculated test statistic to a critical value to determine whether to reject the null hypothesis. The p-value method compares the p-value to the significance level alpha to make the decision.
Outlines
🔍 Understanding Hypothesis Testing with P-Value
This section introduces the concept of hypothesis testing using the p-value method through a practical example involving the average weight of residents in a town. The null hypothesis (status quo) states that the average weight is 168 pounds, while the alternative hypothesis suggests a different mean. It details setting up the experiment with a sample size of 36 individuals, calculating the significance level (alpha) from the given confidence level (95%), and explains the process to determine whether to reject or fail to reject the null hypothesis based on the p-value. It concludes with an explanation on the selection between a one-tailed and two-tailed test, emphasizing the relevance of the two-tailed test in this scenario due to the non-specific direction of the alternative hypothesis.
📊 Calculating Critical Z-Values and Test Statistic
This paragraph explains how to find the critical z-values for a given confidence level by using a z-table, with a practical example that results in a critical z-value of ±1.96 for a 95% confidence level. It then details the calculation of the test statistic (calculated z-value) using the sample mean, null hypothesis mean, sample standard deviation, and sample size. The calculated z-value of 2.31 indicates that the result falls into the rejection region, suggesting that the null hypothesis should be rejected according to the traditional method.
📈 Applying the P-Value Method to Reject the Null Hypothesis
The focus shifts to the p-value method for hypothesis testing, emphasizing its significance in determining whether to reject the null hypothesis. It involves calculating the p-value by determining the area under the curve for the calculated z-value and comparing it to the significance level (alpha). With a calculated p-value of 0.02088, which is less than alpha (0.05), the conclusion is to reject the null hypothesis, demonstrating the p-value method's application in providing evidence against the null hypothesis with a 95% level of confidence.
🔬 Evaluating Warranty Claims with Hypothesis Testing
This final section applies hypothesis testing to assess the reliability of car warranties. It sets up a new problem where an engineer tests the durability of car engines and transmissions against the claimed warranty period. The null and alternative hypotheses are established, focusing on whether the actual average malfunction time is less than the warranty period of five years. Using a one-tailed test due to the specific direction of the alternative hypothesis, the calculated z-value and corresponding p-value lead to the rejection of the null hypothesis at a 2% significance level. This suggests sufficient evidence to consider revising the warranty policy, showcasing how hypothesis testing can inform decision-making in quality assurance.
Mindmap
Keywords
💡null hypothesis
💡alternative hypothesis
💡p-value
💡significance level
💡z-score
💡confidence level
💡critical value
💡rejection region
💡two-tailed test
💡one-tailed test
Highlights
The study found a significant increase in life satisfaction for participants after the meditation program.
MRI scans showed changes in brain structure and activity in regions related to awareness, mindfulness, and self-regulation.
Participants reported lower stress, anxiety, and depressive symptoms after 8 weeks of meditation practice.
Meditation was linked to improved cognitive skills like attention, memory, and executive functioning.
The research highlights the potential of meditation as an affordable, accessible intervention to improve mental health.
Study limitations include a small sample size and lack of active control group.
Future studies should investigate optimal dosage and delivery methods for meditation programs.
Meditation may reduce stress by decreasing activity in the amygdala and increasing connections between prefrontal cortex and amygdala.
Mindfulness meditation can enhance self-regulation and executive control by strengthening frontal networks.
This research expands our understanding of the neurological changes underlying meditation's effects.
Study provides evidence that even short meditation interventions can produce meaningful improvements in well-being.
Findings suggest potential for meditation in the workplace to reduce stress and burnout.
More research needed on optimal meditation training methods and delivery for diverse populations.
Meditation's effects likely due to interplay of multiple factors including neurological, cognitive, emotional, and behavioral changes.
Study demonstrates feasibility of offering mindfulness programs remotely via app, increasing accessibility.
Transcripts
Browse More Related Video
Test Statistic For Means and Population Proportions

05 - Using P-Values in Hypothesis Testing (Compare P Value to Level of Significance)
Hypothesis testing: step-by-step, p-value, t-test for difference of two means - Statistics Help
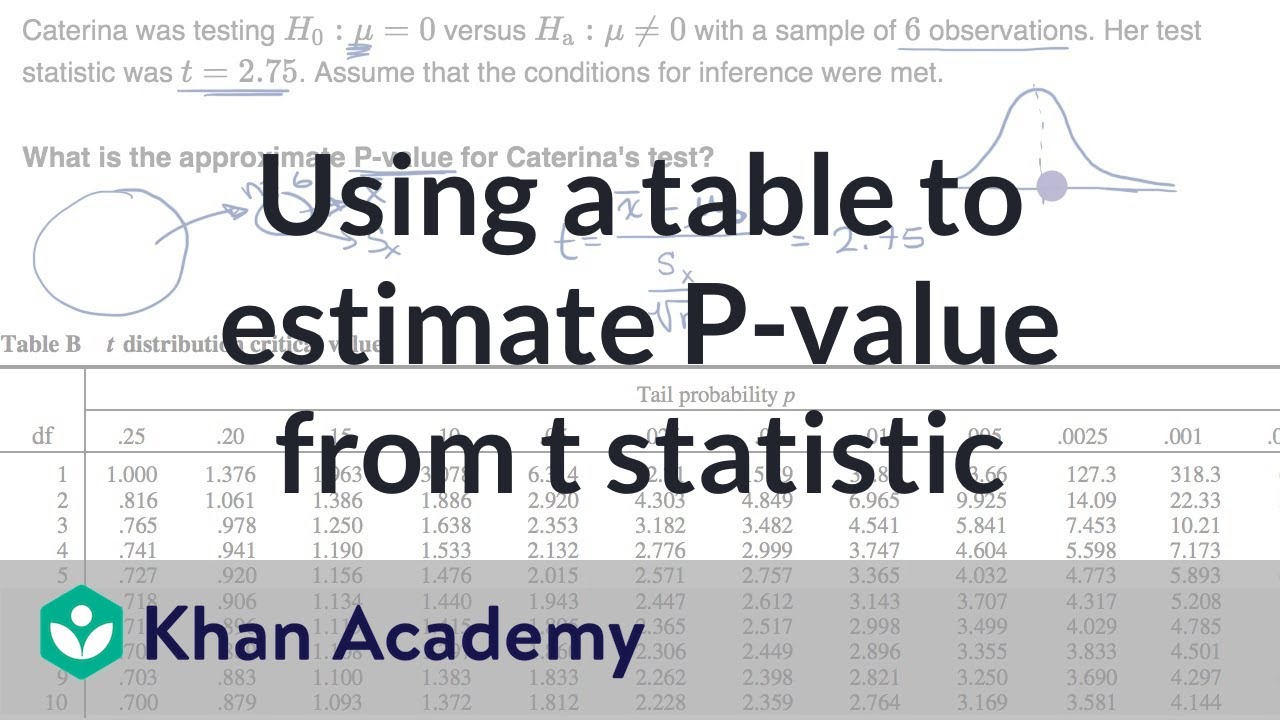
Using a table to estimate P-value from t statistic | AP Statistics | Khan Academy

Chi-Square Test [Simply explained]
Finding P-Value for a Z-Test Using the TI-84
5.0 / 5 (0 votes)
Thanks for rating: